Fig. 10
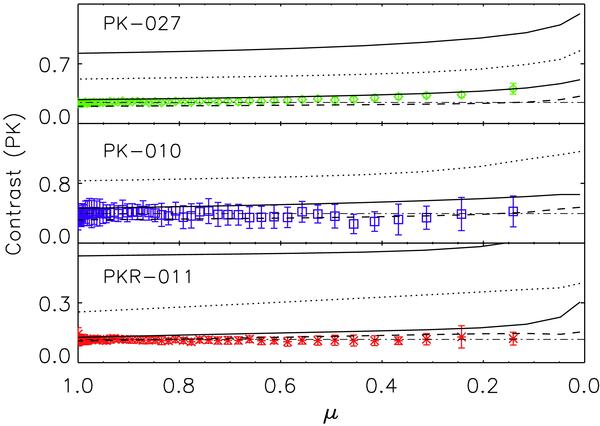
CLV of median contrast values measured (symbols) for plage regions in PK-027 (top panel), PK-010 (middle panel), and PKR-011 (bottom panel) images. For each bandpass, the dot-dashed line indicates the average of values measured at disk positions μ ≥ 0.9, while dotted, dashed, solid, and triple-dot-dashed lines show the respective CLV derived from calculations with PRD for models H and F by Fontenla et al. (2009), and for models F and P by Fontenla et al. (1993), respectively. For PK-010, synthesis results for model P of Fontenla et al. (1993) lie outside the plotted range.
Current usage metrics show cumulative count of Article Views (full-text article views including HTML views, PDF and ePub downloads, according to the available data) and Abstracts Views on Vision4Press platform.
Data correspond to usage on the plateform after 2015. The current usage metrics is available 48-96 hours after online publication and is updated daily on week days.
Initial download of the metrics may take a while.