Free Access
Fig. 1
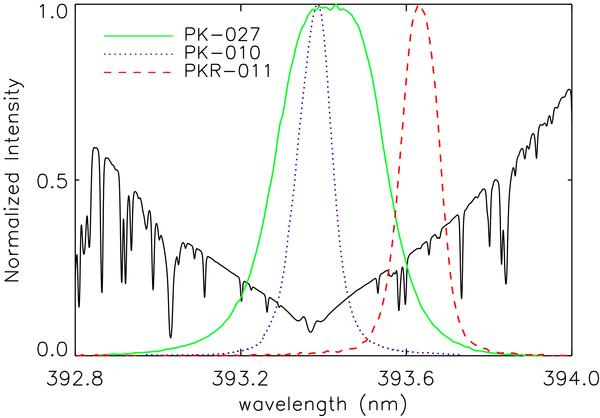
Transmission profiles of the three PSPT interference filters considered in this study. The three profiles, each normalized to its maximum, are represented with different colors and lines as indicated in the legend. They are superimposed on the solar reference spectrum (black line) provided by Delbouille et al. (1972).
Current usage metrics show cumulative count of Article Views (full-text article views including HTML views, PDF and ePub downloads, according to the available data) and Abstracts Views on Vision4Press platform.
Data correspond to usage on the plateform after 2015. The current usage metrics is available 48-96 hours after online publication and is updated daily on week days.
Initial download of the metrics may take a while.