Fig. 7
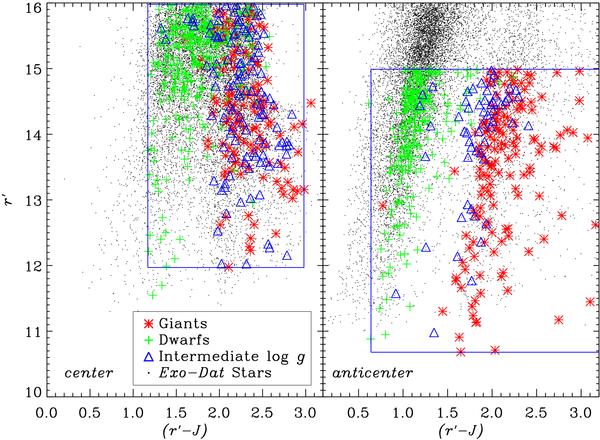
Color magnitude diagrams for the giants (red stars) and the dwarfs (green crosses), as well as the stars with an intermediate log g (blue triangles). All the stars in the Exo-Dat (black dots) are over plotted in the diagram. The dichotomy giant-dwarf comes from the MATISSE parameters. The blue boxes correspond to the limits in color and magnitude for the de-biasing of our sample.
Current usage metrics show cumulative count of Article Views (full-text article views including HTML views, PDF and ePub downloads, according to the available data) and Abstracts Views on Vision4Press platform.
Data correspond to usage on the plateform after 2015. The current usage metrics is available 48-96 hours after online publication and is updated daily on week days.
Initial download of the metrics may take a while.