Fig. 7
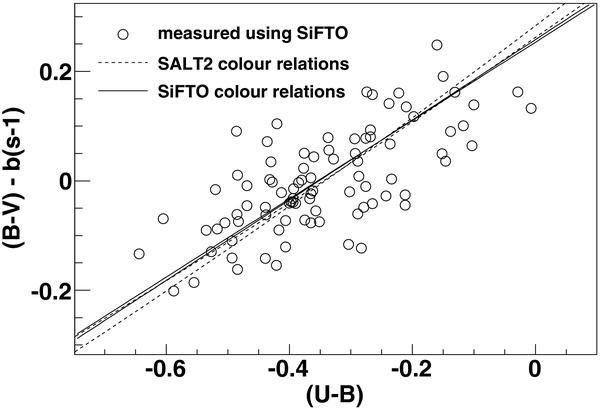
(B−V) corrected for stretch as a function of (U−B) for a selected sample of SNLS SNe as measured by SiFTO (open circles) along with the linear relations of Eq. (4) and Table 5 (a and c terms, solid lines) and the synthetised ones of SALT2 (dashed line) for the two colour scatter hypothesis. SALT2 does not contain explicitly colour relations as SiFTO, but the a,b and c coefficients can still be derived from the model.
Current usage metrics show cumulative count of Article Views (full-text article views including HTML views, PDF and ePub downloads, according to the available data) and Abstracts Views on Vision4Press platform.
Data correspond to usage on the plateform after 2015. The current usage metrics is available 48-96 hours after online publication and is updated daily on week days.
Initial download of the metrics may take a while.