Fig. 11
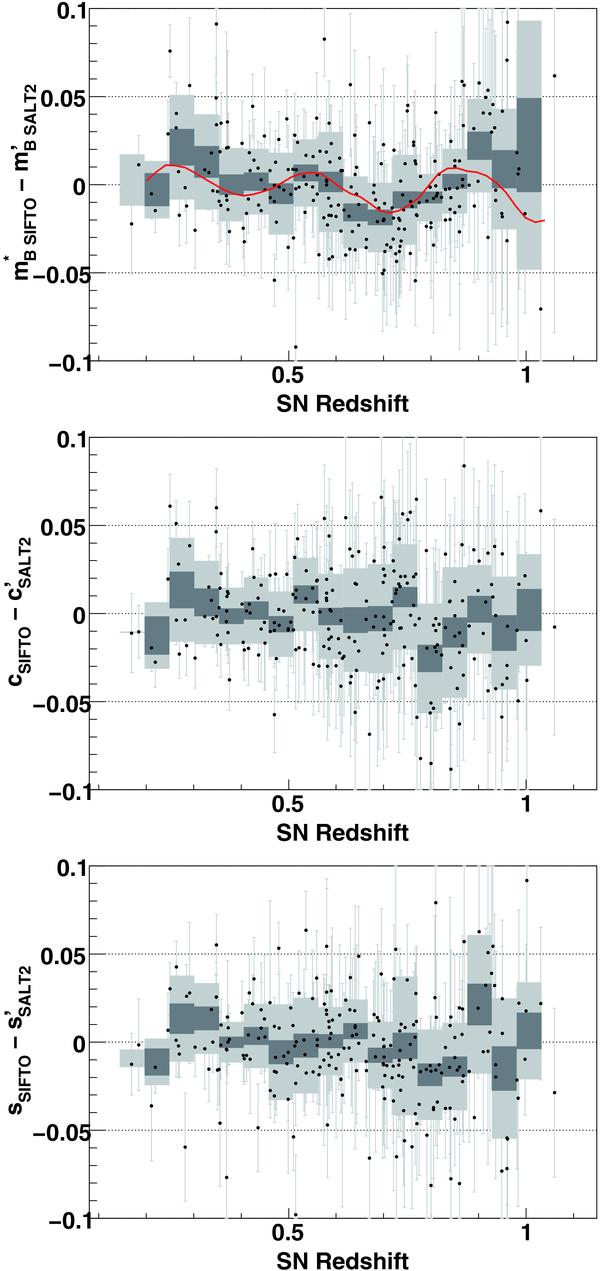
Comparison of SALT2 and SiFTO parameters for a selected sub-sample of SNe of Table 11. Linear transformations of Eq. (6) and Table 6 were applied to SALT2 parameters. Each dot is a SN, the light grey areas represent the rms of the distribution in redshift bins, and the dark areas the uncertainty on the average values. The red curve on the top panel for the rest-frame B band peak magnitude is the expected discrepancy due to the differences of the SALT2 and SiFTO spectral sequences.
Current usage metrics show cumulative count of Article Views (full-text article views including HTML views, PDF and ePub downloads, according to the available data) and Abstracts Views on Vision4Press platform.
Data correspond to usage on the plateform after 2015. The current usage metrics is available 48-96 hours after online publication and is updated daily on week days.
Initial download of the metrics may take a while.