Fig. 18
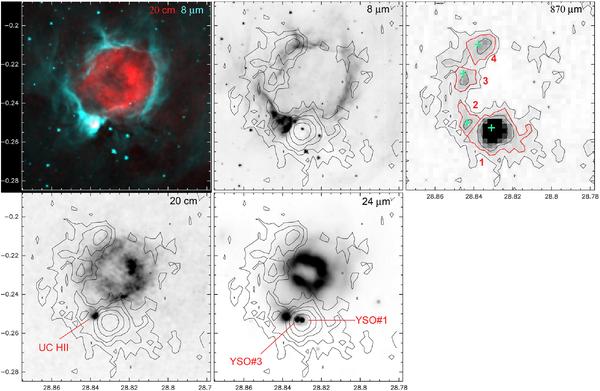
N49. Top left: Spitzer-GLIMPSE 8.0 μm emission in turquoise and 24 μm emission in red. Others: contours of 870 μm emission superimposed to greyscale images at 8.0 μm, 870 μm, 20-cm, and 24 μm; the 870 μm contour levels are 0.08 Jy/beam (used to define the limits of the collected shell), 0.25, 0.5, 1.0, and 2.0 Jy/beam. The red contours at 0.25 Jy/beam have been used to measure the integrated 870 μm flux of condensations 1 to 4. The green crosses indicate the NH3 positions measured by Wyrowski & Wienen (in preparation; Table A.2). The massive stage I YSOs found by Watson et al. (2008) are indicated.
Current usage metrics show cumulative count of Article Views (full-text article views including HTML views, PDF and ePub downloads, according to the available data) and Abstracts Views on Vision4Press platform.
Data correspond to usage on the plateform after 2015. The current usage metrics is available 48-96 hours after online publication and is updated daily on week days.
Initial download of the metrics may take a while.