| Issue |
A&A
Volume 523, November-December 2010
|
|
|---|---|---|
| Article Number | A6 | |
| Number of page(s) | 35 | |
| Section | Galactic structure, stellar clusters and populations | |
| DOI | https://doi.org/10.1051/0004-6361/201014422 | |
| Published online | 10 November 2010 | |
Online material
Appendix A: The distance to the bubbles
The distances to the H ii regions in the center of the bubbles (or associated with them, see the footnotes) are given in Table A.2. These distances are kinematic distances (based on the velocity of the ionized gas measured mostly using radio recombination lines, and assuming circular rotation around the Galactic center). All the regions belong to the first quadrant. Therefore, each positive velocity has two possible distance solutions. This is known as the kinematic distance ambiguity (KDA).
Seventy-four H ii regions have a measured velocity and fifty-seven of them have the KDA resolved. Most of the distances given in Table A.2 are from Anderson & Bania (2009), who resolved the KDA using two methods, one comparing the velocity of the ionized gas with the maximum velocity of H i absorption (H i emission/absorption), and one looking for H i absorption at the velocity of molecular emission (H i self-absorption). We also used distances from Sewilo et al. (2004), who resolved the distance ambiguity by comparing the velocity of the ionized gas with that of the H2CO absorbing material along the same line of sight. Additional velocity measurements are from the Green Bank Telescope H ii Region Discovery Survey (Anderson et al. 2010a, in prep.). For these new measurements, the distance was derived using the H i emission/absorption method (Anderson et al. 2010b, in prep). When the KDA was not resolved, we indicate in Table A.2 the two possible kinematic distances obtained using the Galactic rotation curve of Brand & Blitz (1993). In a few cases, two velocity components have been measured; they are both given in Table A.2.
Class II methanol masers (emitters at 6.7 GHz) are considered as signposts of recent massive-star formation. Twenty-nine methanol masers have been detected in the vicinity of the bubbles studied in this paper. Their coordinates and velocities are also given in Table A.2. We also report in this table the distances estimated by Pandian et al. (2008) for these masers. The KDA is resolved by comparing the maser velocity with the maximum velocity of the H i absorption in the same direction.
The velocities of several bright 870 μm condensations have been measured by F. Wyrowsky and M. Wienen, using the NH3 (1, 1) inversion line (Wienen et al., in preparation). This information allows to confirm the association of the dust condensations with the nearby bubbles and H ii regions. These velocities are also given in Table A.2.
The distances to two bubbles are especially problematic. The bipolar bubble N52 (W43) has a recombination line velocity of 91.6 km s-1 (Lockman 1989), which is near the tangent point velocity in this direction (105 kms-1 according to Brand & Blitz 1993). Differentiating between the near and the far kinematic distances using H i absorption, as A&B have done, relies on the detection of H i absorption between the recombination line velocity and the tangent point velocity. If these two velocities cannot be clearly separated, this method gives less reliable results than when they can. A&B also used the H i self-absorption method, this analysis favoring the near distance for N52, in agreement with Downes et al. (1980) and Kuchar & Bania (1994).
The H ii region enclosed by N59 has a recombination line velocity of 87.4 km s-1 (Araya et al. 2002), which is near the tangent point velocity of 97.9 km s-1 according to the Brand & Blitz (1993) rotation curve. There is, however, H i absorption from the H ii region’s continuum beyond the tangent point velocity, which favors the far distance. A&B assigned the near distance based on H i self-absorption alone since the H i absorption method is less reliable for sources with velocities near the tangent point velocity than distinct from it. Pandian et al. (2008) favor the far distance based on H i absorption analysis. It seems likely, given the strong absorption at more than 10 km s-1 from the recombination line velocity, that N59 is at the far distance.
Nature of the bubbles.
Velocities and distances.
Appendix B: Column density and mass estimated from the 870 μm dust emission
In the following, we assume that the 870 μm emission arises from thermal dust grains. According to Hildebrand (1983), the total (gas+dust) mass of a condensation is related to its flux density Sν by 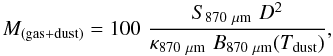 where D is the distance of the source, κ870 μm is the dust opacity per unit mass at 870 μm, and B870 μm(Tdust) is the Planck function for a temperature Tdust. For all the estimates in this paper, we assumed a gas-to-dust ratio of 100, a dust temperature of 20 K, and an opacity κ870 μm = 1.8 cm2 g-1. All these values are uncertain and the subject of discussion.
With the same assumptions, we can estimate the H2 column density, N(H2), from the surface brightness F870 μm, using the formula 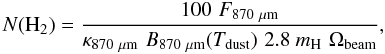 where F870 μm is expressed in Jy beam-1, B870 μm in Jy, N(H2) is per square centimetre, the hydrogen atom mass mH is in grams, and the beam solid angle Ωbeam is in steradians.
Adopting Ωbeam = 9.817 × 10⁻⁹ sr corresponding to a beam of  (FWHM), and assuming Tdust = 20 K, this gives
 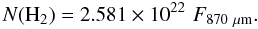 From the classical relations, N(H + H2) / E(B − V) = 5.8 × 10²¹ particles cm-2 mag-1 (Bohlin et al. 1978) and AV = 3.1E(B − V), we obtain AV = 5.34 × 10⁻²² N(H2) = 13.78F870 μm.
© ESO, 2010
Current usage metrics show cumulative count of Article Views (full-text article views including HTML views, PDF and ePub downloads, according to the available data) and Abstracts Views on Vision4Press platform.
Data correspond to usage on the plateform after 2015. The current usage metrics is available 48-96 hours after online publication and is updated daily on week days.
Initial download of the metrics may take a while.