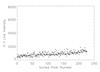
Fig. 9
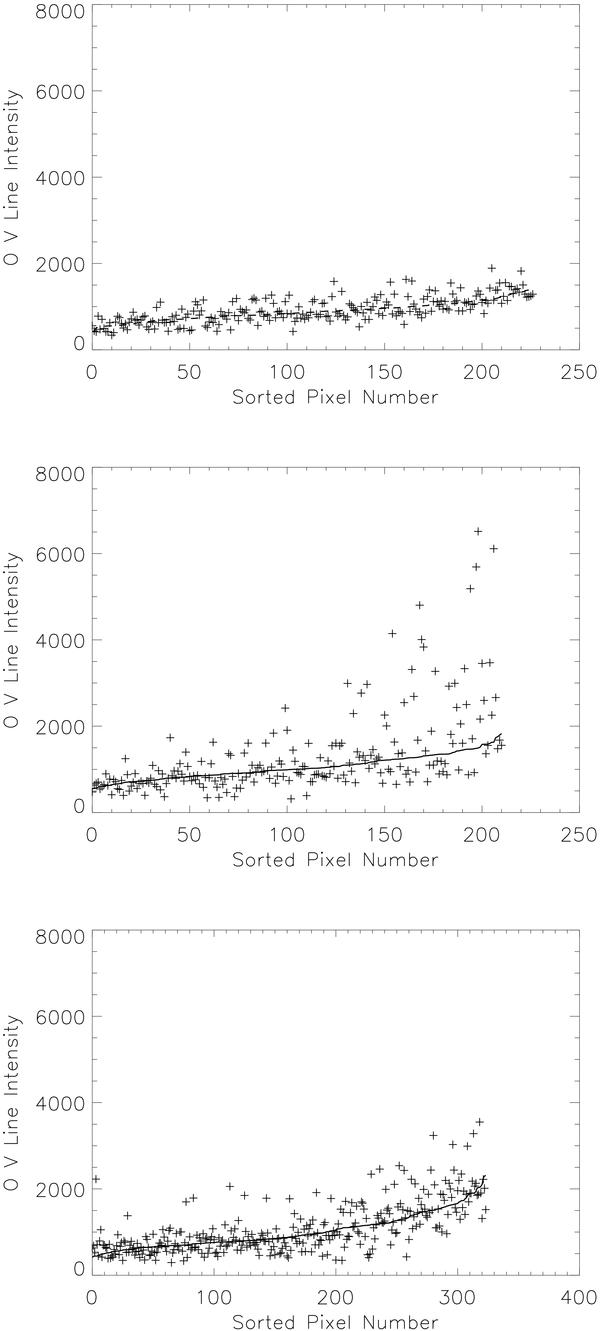
Comparison of observed OV line intensities with the fitted model (I ∝ |φ| δLλ) for optimum δ and λ, for active regions 1 (top), 2 (middle) and 3 (bottom), using 4′′ × 4′′ pixels. Intensities are in units of erg cm-2 s-1 sr-1. The continuous line are fitted values, sorted in ascending order. Crosses are corresponding observed intensities. These plots include all pixels with |B| > 90 Mx cm-2.
Current usage metrics show cumulative count of Article Views (full-text article views including HTML views, PDF and ePub downloads, according to the available data) and Abstracts Views on Vision4Press platform.
Data correspond to usage on the plateform after 2015. The current usage metrics is available 48-96 hours after online publication and is updated daily on week days.
Initial download of the metrics may take a while.