Free Access
Fig. 8
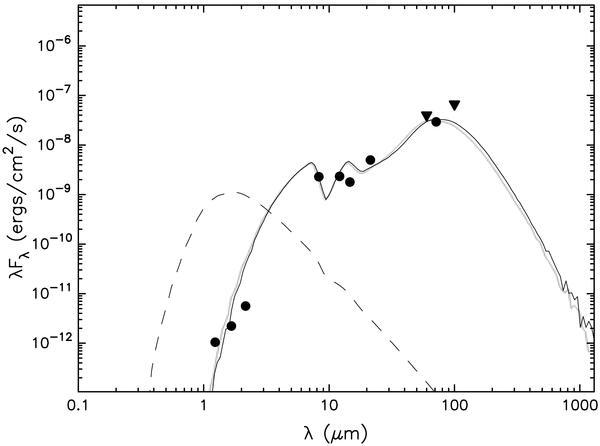
SED fit, using the web tool as explained in Robitaille et al. (2007). The dots represent flux values from NTT source #8 (this work), MSX6C and 70 μm Spitzer-MIPSGal. The triangles represent 60 and 100 μm IRAS data.
Current usage metrics show cumulative count of Article Views (full-text article views including HTML views, PDF and ePub downloads, according to the available data) and Abstracts Views on Vision4Press platform.
Data correspond to usage on the plateform after 2015. The current usage metrics is available 48-96 hours after online publication and is updated daily on week days.
Initial download of the metrics may take a while.