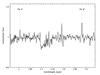
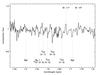
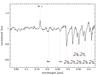
Fig. 7

Near-infrared spectrum of the central region of IRAS 16353−4636, acquired with the NTT on 2004 July 10. The identified emission lines are indicated, most notably Paβ, Paδ, 12CO lines and bands, 13CO bands, Brγ, and possibly Br10, and Br11. Upper panel: NIR J-band spectrum. Central panel: NIR H-band spectrum. Lower panel: NIR Ks-band spectrum.
Current usage metrics show cumulative count of Article Views (full-text article views including HTML views, PDF and ePub downloads, according to the available data) and Abstracts Views on Vision4Press platform.
Data correspond to usage on the plateform after 2015. The current usage metrics is available 48-96 hours after online publication and is updated daily on week days.
Initial download of the metrics may take a while.