Fig. 5
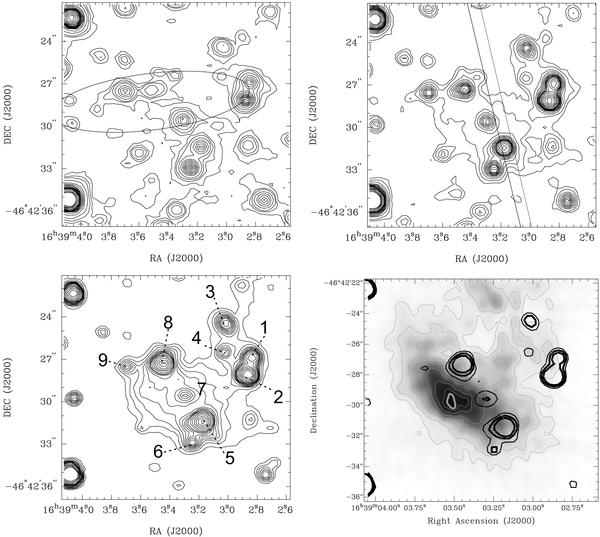
Upper left panel: J-band image of the region toward IRAS 16353−4636, obtained with the NTT on 2004 July 10. Levels: 1, 3, 5, 10, 20, ..., 100, 120, 150, 190, 250, 320, and 400 Jy. The uncertainty in the position of the IRAS source is indicated by an ellipse. Upper right panel: the same as the upper left panel but in the H band. Levels: 5, 10, 20, ..., 400 Jy. We show the position and size of the slit used for spectroscopic purposes. Lower left panel: the same as the upper left panel but in the Ks band. Levels: 20, 30, ..., 400 Jy. The extended emission appears more clearly than in the J- and H-band images. Several point-like sources are visible, and labeled with numbers as in Table 3, at increasing right ascension. Lower right panel: continuum emission at 17.344 GHz in greyscale and grey contours, superimposed on to black contours corresponding to strongest near-IR Ks sources. North is up and east is to the left.
Current usage metrics show cumulative count of Article Views (full-text article views including HTML views, PDF and ePub downloads, according to the available data) and Abstracts Views on Vision4Press platform.
Data correspond to usage on the plateform after 2015. The current usage metrics is available 48-96 hours after online publication and is updated daily on week days.
Initial download of the metrics may take a while.