Fig. 2
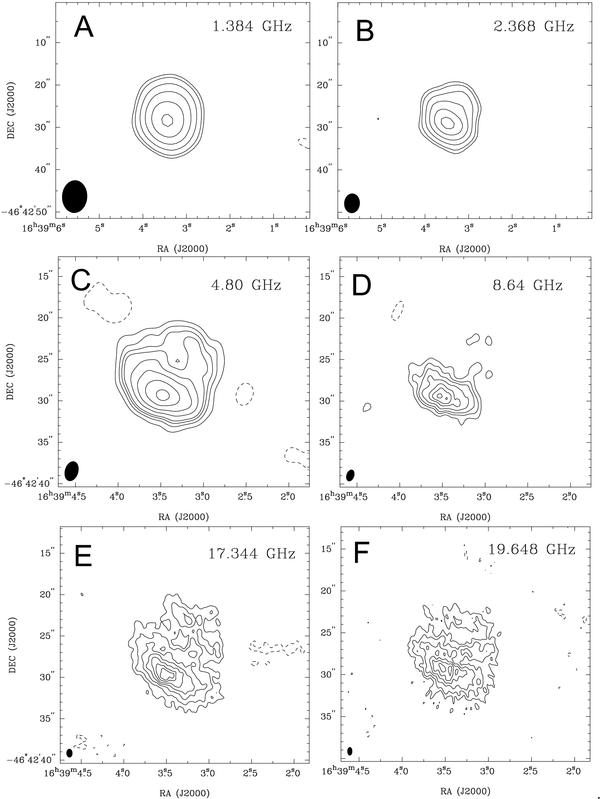
ATCA radio continuum images of IRAS 16353−4636. A: image at 1.4 GHz; contour levels of −3, 3, 5, 10, 18, 30, and 45 times the rms noise of 1.0 mJy beam-1. B: image at 2.4 GHz; contour levels of −3, 3, 5, 10, 18, 30, and 45 times the rms noise of 0.5 mJy beam-1. C: image at 4.8 GHz; contour levels of −3, 3, 6, 9, 12, 20, 30, 45 and 60 times the rms noise of 0.14 mJy beam-1. D: image at 8.64 GHz; contour levels of −3, 3, 6, 9, 12, 20, 24 and 28 times the rms noise of 0.09 mJy beam-1. E: image at 17.344 GHz; contour levels of −3, 3, 5, 8, 11, 14, 17, 19, and 20 times the rms noise of 0.10 mJy beam-1. F: image at 19.648 GHz; contour levels of −3, 3, 5, 8, 11, 14, 17, 19, and 20 times the rms noise of 0.09 mJy beam-1. Synthesized beams are plotted at bottom left corners. North is up and east is to the left
Current usage metrics show cumulative count of Article Views (full-text article views including HTML views, PDF and ePub downloads, according to the available data) and Abstracts Views on Vision4Press platform.
Data correspond to usage on the plateform after 2015. The current usage metrics is available 48-96 hours after online publication and is updated daily on week days.
Initial download of the metrics may take a while.