| Issue |
A&A
Volume 523, November-December 2010
|
|
|---|---|---|
| Article Number | A63 | |
| Number of page(s) | 5 | |
| Section | Extragalactic astronomy | |
| DOI | https://doi.org/10.1051/0004-6361/200913794 | |
| Published online | 17 November 2010 | |
Detection of extended molecular gas in the disk of the LSB galaxy Malin 2
1
Raman Research Institute, Sadashivanagar,
Bangalore, 560080, India
email: This email address is being protected from spambots. You need JavaScript enabled to view it.
2
Birla Institute of Technology and Science - Pilani, Hyderabad
Campus, Jawahar Nagar, Shameerpet Mandal, Hyderabad, 500078, India
3
Observatoire de Paris, LERMA, 61 avenue de l’Observatoire,
75014
Paris,
France
email: This email address is being protected from spambots. You need JavaScript enabled to view it.
; This email address is being protected from spambots. You need JavaScript enabled to view it.
Received:
2
December
2009
Accepted:
4
June
2010
Abstract
Aims. Our goal is to see if there is molecular gas extending throughout the optical low surface brightness disk of the galaxy Malin 2.
Methods. We used the heterodyne receiver array (HERA) mounted on the IRAM 30 m telecope to make deep observations at the frequency of the CO(2–1) line at nine different positions of Malin 2. With a total observing time of 11 h at a velocity resolution of 11 km s-1 we achieve a sensitivity level of 1 mK.
Results. We detect CO(2–1) line emission from Malin 2. The line is detected in four of the nine HERA beams; a fifth beam shows a marginal detection. These results not only confirm that there is molecular gas in the disk of Malin 2, but they also show that it is spread throughout the inner 34 kpc radius as sampled by the observations of the galaxy disk. The mean molecular gas surface density in the disk is 1.1 ± 0.2 M⊙ pc-2, and the molecular gas mass lies between the limits 4.9 × 10⁸ to 8.3 × 10⁸ M⊙. The observed velocity dispersion of the molecular gas is higher (~13 km s-1) than in star-forming galactic disks. This could explain the disk stability and its low star-formation activity.
Key words: galaxies: spiral / galaxies: kinematics and dynamics / galaxies: ISM / ISM: molecules / radio lines: ISM / galaxies: individual: Malin 2
© ESO, 2010
1. Introduction
Low surface brightness (LSB) galaxies are the most unevolved class of galaxies in our nearby Universe (Impey & Bothun 1997). They are optically dim with diffuse stellar disks (Auld et al. 2006), massive HI gas disks (O’Neil et al. 2004; Matthews et al. 2001) but have low star-formation rates compared to regular spiral galaxies (McGaugh 1994). They are halo-dominated galaxies (de Blok & McGaugh 1996; Kuzio de Naray et al. 2008; Coccato et al. 2008); this may account for the weak spiral arms and small bar perturbations observed in these galaxies (Mihos et al. 1997; Mayer & Wadsley 2004). Although the most commonly observed LSB galaxies are the dwarf LSB galaxies (Sabatini et al. 2003), a significant fraction of LSB galaxies are large spirals with prominent bulges (Beijersbergen et al. 1999). These giant LSB (GLSB) galaxies have extended LSB disks that are poor in star formation and dust (Rahman et al. 2007; Hinz et al. 2007). The bulge-dominated GLSB galaxies often show AGN activity (Schombert 1998; Das et al. 2009).
Even though the optical properties of LSB galaxies have been investigated in great depth, not much is known about their molecular gas content. This is important as a knowledge of the cold gas distribution in LSB galaxies will help us understand star-formation processes in these galaxies. Surveys of LSB galaxies show that they have fairly massive HI disks that may be more than twice the size of the optical disk (de Blok et al. 1996; Pickering et al. 1997; Das et al. 2007). In this paper we examine the molecular gas distribution in a GLSB galaxy and see how it relates to the overall star formation in its disk. Molecular gas has been detected in only a handful of LSB galaxies (O’Neil et al. 2000; Matthews & Gao 2001; O’Neil et al. 2003; Matthews et al. 2005; Das et al. 2006). In most cases the galaxies were large spirals with extended optically dim disks. The low detection rate of molecular emission from LSB galaxies is probably due to several factors related to the poor star-formation rate in these galaxies (e.g. de Blok & van der Hulst 1998); factors such as the lower dust content, lower metallicity and the lower surface density of cold, neutral gas in these galaxies. All of these properties lead to a slower rate of gas cooling and molecule formation. For the few galaxies where molecular gas has been detected, not much is known about the gas extent and distribution. This information is important if we want to understand star formation and disk evolution in LSB galaxies.
To investigate the molecular gas and star formation in GLSB galaxies we studied the CO distribution in a galaxy where molecular gas has been detected, F568-6 or Malin 2, as it is widely known (Das et al. 2006). It is a nearly face-on GLSB galaxy at a distance of 201 Mpc. It has a prominent bulge and a very extended LSB disk. Its parameters are summarised in Table 1. There are several localized star-forming regions distributed over its inner disk. Its metalicity is one third of the solar metalicity in value, which is relatively high for an LSB galaxy (McGaugh 1994). The CO observations of Malin 2 were conducted using the HERA instrument mounted on the 30 m IRAM telescope. Our main aim was to examine the molecular gas distribution; determine its extent, total gas mass and surface density.
2. Observations
During 2007 March we observed the CO(2–1) line in Malin 2 with the HERA beam array (Schuster et al. 2004) on the IRAM 30 m telescope at a fequency of 220.372 GHz. We specifically used this array because it has a wide field of view and good sensitivity. HERA is made of nine receivers in a 3 × 3 array spaced by 24'' on the sky. The backend used was the Wideband Line Multiple Autocorrelator (WILMA). The total bandwidth was 930 Hz; it was made up of 465 channels of 2 MHz each. The typical system temperatures Tsys were in the range 200–250 K for eight receivers; one receiver had a systematically higher Tsys in the range 350–450 K. The mean FWHM of each of the nine beams is 11.7''. As our main goal was to detect the CO emission line from the disk of Malin 2, we kept the array fixed on the sky in the standard pointed mode with the central beam pointed to the galactic nucleus; the field was tracked to get deep integrations at fixed positions in the disk. This enabled us to achieve good sensitivity, but at the cost of undersampling the source. We obtained deep observations at nine positions of the galaxy with a total on source-integration time of 11 h (Fig. 1). The observations were frequency switched. The intrinsic velocity resolution was 2.7 km s-1; the data were then smoothed using a Hanning squared function.
We reduced the data with the CLASS software of the GILDAS package1 by fitting a first order baseline to all spectra within a window going from −400 to +400 km s-1 about the galaxys’ systemic velocity of 13830 km s-1. This window was the same for all nine spectra. The noise level is not the same for all receivers; the lowest is 0.7 mK and the highest is 1.6 mK in the 10.9 km s-1 channels. The noise is also not uniform across the band. Hence we computed the baseline and the noise in the −400 +400 window using emission free channels only. All the details are given in Table 2. The conversion factor from K to Jy is 8.6 Jy K-1. To convert from the antenna temperature scale  to the main beam temperature Tmb we multiplied by the factor Feff / Beff = 1.67, where Feff is the forward-beam efficiency and Beff is the main-beam efficiency.
Galaxy parameters – Malin 2.
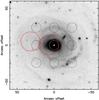 |
Fig. 1 R band image of the galaxy Malin 2 with the HERA footprint overlaid as nine black circles. The red circles correspond to the previous IRAM observations at 115 GHz (Das et al. 2006). Each circle has a diameter equal to the FWHM of the corresponding beam. |
CO(2–1) fluxes, kinematical parameters, molecular, HI, and total gas surface densities.
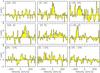 |
Fig. 2 CO(2–1) spectra obtained with the nine HERA receivers. The offsets in arcsecond from the galaxy center are marked in the top left hand corner of each figure. CO(2–1) emission was detected from five locations. The Gaussian fits for these detections are overlaid on the spectra. The x-axes are the velocity offsets from the galaxy systemic velocity (vhel = 13830 km s-1) and the y-axes are the measured antenna temperatures ( |
3. Results
We have detected CO(2–1) emission from several positions in the disk as well as from the center of Malin 2. In the paragraphs below we present our results and discuss their implications.
3.1. CO(2–1) detections
Figure 2 shows the CO(2–1) emission spectra observed from nine locations across Malin 2. The offsets from the galaxy center are indicated in each box. CO(2–1) emission was detected from four out of nine positions at line intensities above 3σ. The line at (−24, 24) is a a hint of emission rather than a sure detection. At (0, 0) the line is broad but is a 3σ detection. We estimated the line parameters (flux, width, central velocity) by fitting a Gaussian to each spectrum. We determined the noise level for each of the nine positions. The results are listed in Table 2 and the best-fit Gaussians are overlaid on the spectra in Fig. 2.
3.2. Comparison with previous CO observations
Molecular gas has been detected earlier in this galaxy by Das et al. (2006) with the IRAM 30 m telescope and the BIMA array. However, due to a correlator setup problem the BIMA map was incomplete, it was covering a velocity range corresponding to CO(1–0) line emission from the east side of the galaxy only. In addition, the 30 m telescope was pointed toward two directions only at 7'' and ~35'' east of the nucleus (see Fig. 1). Although the source was observed simultaneously at 115 GHz and 230 GHz with the 30 m telescope, only CO(1–0) emission was detected; the CO(2–1) line was not detected from either position. Our present observations cover the CO emission over a wider velocity and spatial extent than these previous observations and hence give a better idea of the distribution of molecular gas in the inner disk of Malin 2. These observations are also the first detections of the CO(2–1) line in Malin 2. Our detection lies below the detection limit of the older observations of Das et al. (2006). Their CO(2–1) emission spectrum had a noise (rms) of 2.6 mK, whereas our line detections have a peakof 2 to 3 mK (Fig. 2).
Near the galaxy center, where there is overlap with the previous CO detection, the CO line velocities are in the same direction and are similar in shape and in width. Close to the center of the galaxy the CO(1–0) line as detected by Das et al. (2006) is broad (~200 km s-1) and asymmetric with the red side slightly more prominent than the blue side. The CO(2–1) line detected at the center of the galaxy by our new HERA observations is 243 ± 76 km s-1 wide and at a centroid position offset by 77 ± 34 km s-1 relative to the systemic velocity given in Table 1. Investigating the cause of this offset would require interferometric observations. As the beams and pointing directions are different (23'' for the CO(1–0) line and 11'' for the CO(2–1) line), the fluxes cannot be directly compared. But if the molecular gas were uniformly distributed we would expect a line ratio in temperature scale close to the range of values found by Braine & Combes (1992) with the same telescope i.e., 0.4 to 1.2. We checked this for the HERA central beam whose pointing direction is the closest to the central pointing of Das et al. (2006). A rough comparison of the brightness in mK km s-1 gives ICO(2−1) / ICO(1−0) = 0.43 / 1.01 = 0.43 (where the CO(2–1) line intensity from the HERA central pointing is 0.43 and the CO(1–0) intensity from IRAM is 1.01). This value is at the lower end of the line ratio range for most galaxies, but given the uncertainties (e.g. gas distribution), the value shows that the CO(2–1) line intensity we measure is consistent with the previous CO(1–0) detection.
3.3. Comparison with HI observations
High-sensitivity HI VLA observations of Malin 2 were presented by Pickering et al. (1997). These reveal the distribution of the HI gas and its kinematics at a spatial resolution of ~19''. The HI disk is lopsided, the HI emission is significantly more prominent and extends farther out on the western side of the nucleus than on the eastern side. The central region is essentialy devoid of HI gas. Although we have only a partial view of the molecular disk owing to our under-sampled data, its properties are similar to HI. Based on the HI velocity field, the centroid velocity of the HI line profiles at the positions (24, 0), (−24, 0) and (−24, 24), respectively +90, −150 and −110 km s-1 relative to the systemic velocity, agree excellently with those for the molecular gas (Table 2, Col. e). Hence the HI and molecular gas appear to share a common velocity assymmetry when considering the positions (24, 0) and (−24, 0).
The higher spatial and spectral resolutions in CO allow us to better constrain the velocity dispersion of the gaseous component. The CO profile with the narrowest line width is at (−24, 0). Given the spectral response, this leads to a deconvolved velocity dispersion of 13 km s-1. It is the best constraint that we can get for the velocity dispersion of the gas σgas in the disk of Malin 2, given that a) it is obtained in a direction close to the major axis where beam smearing effects due to the rotation of the disk are minimum and b) we do not observe the blue-shifted wing or secondary velocity component that Pickering et al. discovered and had to blank to determine and analyze the rotation curve. These authors interpreted this secondary component as high-velocity clouds, gas infalling onto the disk southwest of the nucleus. It is best seen ~20'' southwest of the nucleus, where it is blue-shifted by as much as ~100 km s-1. Given the correspondance with HII regions in that direction and that there is a relatively moderate HI column density there, they suggested that this infall induces star formation (Wyder et al. 2009). We do not detect CO emission at (−24, −24), which is only ~6'' further away in the southwest. It could be that the disk component in that region is depeleted not only in HI, but also in molecular gas. Spatially fully sampled CO observations would be required to confirm this hypothesis.
In Table 2, the maximum CO(2–1) line velocities are reached in the offsets (24, 0) and (−24, 0), which is consistent with the position angle being close to horizontal ~70° (2MASS images, Jarrett et al. 2003). We note a velocity asymmetry between the emission at (24, 0) and that at (−24, 0), which could be due to infalling gas or a lopsided potential. We can estimate the rotational velocity from these lines. Assuming an inclination of 38° (Matthews et al. 2001) it is on the order (~150 / sin(i) km s-1, which implies a dynamical mass within the 24'' (i.e. 23 kpc) radius of ~3 × 10¹¹ M⊙.
The broad line at the center has a width close to twice the velocities at (24, 0) and (−24, 0) offsets. This could be because the rotation curve turning point is inside the central beam, i.e., inside a radius of 6'' (6 kpc). This central region, which is essentially devoid of HI, is where the strongest emission in CO originates; higher angular resolution CO observations are required to determine the rotation curve in that region. If the curve continued to steadily decrease towards the nucleus, it would point to a model where the gas in the central bulge region is kinematically hot, e.g. because of gas infall to feed the AGN.
3.4. Molecular gas mass
We derived the molecular gas surface densities for each line detection and the results are summarised in Table 2. The column densitites are derived from the line fluxes using N(H2) = X (1 / 0.9) ∫ Tmb [CO(2−1)] dv; where I(2–1)/I(1–0) = 0.9 (Braine & Combes 2000) and the CO to H2 conversion factor is given by X = 2 × 1020 cm-2(K km s-1) for cool virialized molecular clouds (Dickman et al. 1986). The value of X is somewhat uncertain for LSB disks, given their low metalicities and our poor knowledge of the ISM conditions in these galaxies. However, for a first estimate we used this value to determine the surface densities of molecular gas Σmol in Malin 2 (Col. f, Table 2). Assuming the eight directions observed in the disk form a distribution of surface brightness values which is representative for the disk of Malin 2 up to a radius of 40'', the mean CO(2–1) brightness is ~0.15 K km s-1. The central region has a beam-averaged surface density that is three times higher than the mean brightness of the disk. The lower limit for Mmol is ~4.9 × 10⁸ M⊙ and is given by the sum of the four detections in Col. f of Table 2 multiplied by the beam solid angle. To determine the upper limit for Mmol, we used the noise (see Table 2, Col. a) to derive upper limits for the molecular gas surface densities for the regions where there were no detections including (−24, 24), where there is a hint of emission. The upper limit to the total mass of molecular gas within R < 40'' is thus Mmol ~ 8.3 × 10⁸ M⊙. If the molecular disk does not extend beyond 40'', then the molecular gas mass corresponds to ~1.2–2% of the HI gas mass in the galaxy. This is similar to what is observed in normal spiral galaxies that have molecular gas masses typically a few percent of the total HI mass.
3.5. Star-formation threshold
The molecular gas disk in Malin 2 is extended and relatively massive with a significant amount of molecular gas, but its star-formation activity is low compared to normal spirals (Wyder et al. 2009). For galactic disks star formation appears to be controled by the onset of gravitational instabilities (Kennicutt 1989). A simple single-fluid Toomre-disk stability model predicts threshold densities in agreement with the observations. This critical density is given by Σcrit = ακσgas / 3.36 G where κ is the epicyclic frequency and σgas the velocity dispersion of the gas. From a sample of spiral galaxies Kennicutt found α ≃ 0.69. In his study, to evaluate α, Kennicutt assumed that all the galaxies in his sample have approximately the same velocity dispersion, ~6 km s-1, and that it is independent of the radial distance within a galaxy. This is a good approximation given what is known for the galaxies of his sample. Hence the prediction is that to have disk galaxies such as the LSBs immune to star formation, the gas surface density should be below this critical density.
Pickering et al. (1997) determined rotation curves for four GLSBs. These allow them to determine the epicyclic frequency necessary to obtain the radial profiles of Σcrit. They show that by assuming that α = 0.69 is valid for these LSB galaxies and that σgas = 10 km s-1, the critical density is in some regions close or lower than the observed HI surface density, although there is no conspicuious star-formation activity there. This leads them to postulate that σgas must be higher than the assumed value.
In the specific case of Malin 2 Pickering et al. find that the HI surface density never exceeds the critical density except at the location where HI is the brightest (this direction is located a half way between the positions (−24, 24) and (−24, 0)). When considering the nine directions listed in Table 2 only (0, 0) coincides with an Hα source. Using the present CO observations we can examine two questions: 1) does the gas surface density remain below the critical density when the contribution from the molecular gas component is taken into account as did Kennicutt in his analysis? 2) Is σgas ≤ 10 km s-1 used to determine Σcrit adapted in the case of giant LSBs such as Malin 2? Column g in Table 2 gives the HI surface brightnesses. Comparing these with the molecular surface densities (Col. f), the molecular gas surface densities appear to amount to typically 1/2 to 1/3 the HI surface densities, with the exception of position (−24, 0), where HI largely dominates. Column h gives the total gas surface density and in Col. i this quantity relative to the critical density. By using α = 0.69, for internal consistency, the values in Cols. h and i are determined using the same hypothesis as that adopted by Kennicutt for the conversion factor X and the term Z, which accounts for the elements heavier than H. For σgas we adopted the value of 13 km s-1 that we measured with good S/N at (−24, 0) (Sect. 3.3). Better constrained than the 10 km s-1 adopted by Pickering et al., this value is still conservative given that it is the lowest velocity dispersion (Col. d) amongst the five directions where CO is detected. Formally, because all the values in Col. i are smaller than unity, it could be concluded that the disk of Malin 2 is sufficiently stable to prevent star formation. However, the directions (−24, 0) and (−24, 24) have surface densities close to the threshold values, thus preventing us from considering this as a firm result. Also the observed kinematics in western and north-western parts of Malin 2 appears complex because of high-velocity clouds (HVC). It could be that the star-formation activity seen in Malin 2 is more related to the interaction of these HVCs with the disk than to growth of density fluctuations originating from instabilities in the self-graviting rotating disk. A fully sampled image of the Malin 2 and high signal-to-noise to seperate the different velocity components and measure the line widthes are necessary to better understand the properties of Malin 2.
4. Conclusions
-
1.
We report the first detection of CO(2–1) line emission from thedisk of a giant LSB galaxy. Our observations reveal extendedmolecular gas in the disk of the LSB galaxyMalin 2. The radial extent of the molecular disk is atleast 34 kpc and its mean line brightness ~0.15 K km s-1 (on the Tmb temperature scale). With an angular resolution of 11.7'' this is ~2/3 the beam-averaged integrated line intensity in the central region.
- 2.
When we compared the molecular and HI gas masses of Malin 2, we found that the molecular gas fraction is ~1.2–2% of the HI gas mass. At radii ~15 kpc in the directions where CO is detected, the molecular gas fraction is typically 30% to 50% of the HI gas surface densities.
-
3.
We estimated the total surface density of the neutral gas and found that it is always below the critical threshold density for gravitational instability. Hence the disk of Malin 2 is overall stable against large scale star-formation.
Acknowledgments
We are grateful to the IRAM staff at Pico Veleta for excellent support at the telescope. IRAM is supported by INSU/CNRS (France), MPG (Germany) and IGN (Spain). The authors would also like to thank Alice Quillen for providing the R-band images of Malin 2. This research has made use of the NASA/IPAC Extragalactic Database (NED) which is operated by the Jet Propulsion Laboratory, California Institute of Technology, under contract with the National Aeronautics and Space Administration.
References
- Auld, R., de Blok, W. J. G., Bell, E., & Davies, J. I. 2006, MNRAS, 366, 1475 [NASA ADS] [Google Scholar]
- Beijersbergen, M., de Blok, W. J. G., & van der Hulst, J. M. 1999, A&A, 351, 903 [NASA ADS] [Google Scholar]
- Braine, J., & Combes, F. 1992, A&A, 264, 433 [NASA ADS] [Google Scholar]
- Coccato, L., Swaters, R. A., Rubin, V. C., D’Odorico, S., & McGaugh, S. S. 2008, A&A, 490, 589 [NASA ADS] [CrossRef] [EDP Sciences] [Google Scholar]
- Das, M., O’Neil, K., Vogel, S. N., & McGaugh, S. 2006, ApJ, 651, 853 [NASA ADS] [CrossRef] [Google Scholar]
- Das, M., Kantharia, N., Ramya, S., et al. 2007, MNRAS, 379, 11 [Google Scholar]
- Das, M., Reynolds, C. S., Vogel, S. N., McGaugh, S. S., & Kantharia, N. G. 2009, ApJ, 693, 1300 [NASA ADS] [CrossRef] [Google Scholar]
- Dickman, R. L., Snell, R. L., & Schloerb, F. P. 1986, ApJ, 309, 326 [NASA ADS] [CrossRef] [Google Scholar]
- de Blok, W. J. G., McGaugh, S. S., & van der Hulst, J. M. 1996, MNRAS, 283, 18 [NASA ADS] [CrossRef] [Google Scholar]
- de Blok, W. J. G., & van der Hulst, J. M. 1998, A&A, 336, 49 [NASA ADS] [Google Scholar]
- Hinz, J. L., Rieke, M. J., Rieke, G. H., et al. 2007, ApJ, 663, 895 [NASA ADS] [CrossRef] [Google Scholar]
- Impey, C., & Bothun, G. 1997, ARA&A, 35, 267 [NASA ADS] [CrossRef] [Google Scholar]
- Jarrett, T. H., Chester, T., Cutri, R., Schneider, S. E., & Huchra, J. P. 2003, AJ, 125, 525 [NASA ADS] [CrossRef] [Google Scholar]
- Kennicutt, R. C. 1989, ApJ, 344, 685 [NASA ADS] [CrossRef] [Google Scholar]
- Kuzio de Naray, R., McGaugh, S. S., & de Blok, W. J. G. 2008, ApJ, 676, 920 [CrossRef] [Google Scholar]
- Matthews, L. D., & Gao, Y. 2001, ApJ, 549, L191 [NASA ADS] [CrossRef] [Google Scholar]
- Matthews, L. D., van Driel, W., & Monnier-Ragaigne, D. 2001, A&A, 365, 1 [NASA ADS] [CrossRef] [EDP Sciences] [Google Scholar]
- Matthews, L. D., Gao, Y., Uson, J. M., & Combes, F. 2005, AJ, 129, 1849 [NASA ADS] [CrossRef] [Google Scholar]
- Mayer, L., & Wadsley, J. 2004 MNRAS, 347, 277 [NASA ADS] [CrossRef] [Google Scholar]
- McGaugh, S. S. 1994, ApJ, 426, 135 [NASA ADS] [CrossRef] [Google Scholar]
- McGaugh, S. S., Bothun, G. D., & Schombert, J. M. 1995, AJ, 110, 573 [NASA ADS] [CrossRef] [Google Scholar]
- Mihos, J. C., McGaugh, S. S., & de Blok, W. J. G 1997, ApJ, 477L, 79 [NASA ADS] [CrossRef] [Google Scholar]
- O’Neil, K., Hofner, P., & Schinnerer, E. 2000, ApJ, 545, L102 [Google Scholar]
- O’Neil, K., Schinnerer, E., & Hofner, P. 2003, ApJ, 588, 230 [NASA ADS] [CrossRef] [Google Scholar]
- O’Neil, K., Bothun, G., van Driel, W., & Monnier Ragaigne, D. 2004, A&A, 428, 823 [Google Scholar]
- Pickering, T. E., Impey, C. D., van Gorkom, J. H., & Bothun, G. D. 1997, AJ, 114, 1858 [Google Scholar]
- Rahman, N., Howell, J. H., Helou, G., Mazzarella, J. M., & Buckalew, B. 2007, ApJ, 663, 908 [Google Scholar]
- Schuster, K.-F., Boucher, C., Brunswig, W., et al. 2004, A&A, 423, 1171 [NASA ADS] [CrossRef] [EDP Sciences] [Google Scholar]
- Sabatini, S., Davies, J., Scaramella, R., et al. 2003, MNRAS, 341, 981 [NASA ADS] [CrossRef] [Google Scholar]
- Schombert, J. M. 1998, AJ, 116, 1650 [NASA ADS] [CrossRef] [Google Scholar]
- Wyder, T. K., Martin, D. C., Barlow T. A., et al. 2009, ApJ, 696, 1834 [NASA ADS] [CrossRef] [Google Scholar]
All Tables
CO(2–1) fluxes, kinematical parameters, molecular, HI, and total gas surface densities.
All Figures
|
Fig. 1 R band image of the galaxy Malin 2 with the HERA footprint overlaid as nine black circles. The red circles correspond to the previous IRAM observations at 115 GHz (Das et al. 2006). Each circle has a diameter equal to the FWHM of the corresponding beam. |
| In the text | |
|
Fig. 2 CO(2–1) spectra obtained with the nine HERA receivers. The offsets in arcsecond from the galaxy center are marked in the top left hand corner of each figure. CO(2–1) emission was detected from five locations. The Gaussian fits for these detections are overlaid on the spectra. The x-axes are the velocity offsets from the galaxy systemic velocity (vhel = 13830 km s-1) and the y-axes are the measured antenna temperatures ( |
| In the text | |
Current usage metrics show cumulative count of Article Views (full-text article views including HTML views, PDF and ePub downloads, according to the available data) and Abstracts Views on Vision4Press platform.
Data correspond to usage on the plateform after 2015. The current usage metrics is available 48-96 hours after online publication and is updated daily on week days.
Initial download of the metrics may take a while.