Fig. 9
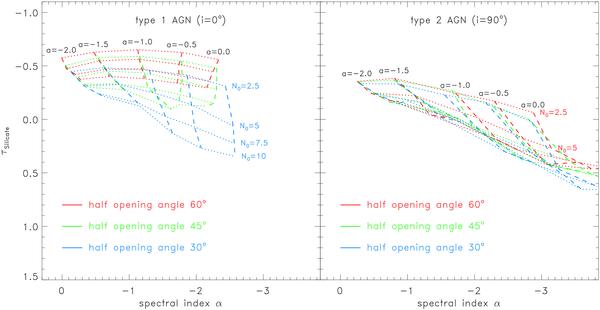
Dependence of observed silicate-feature optical-depth τSi and mid-IR spectral index α on model parameters. The grids show how τSi and α change with a (dotted lines; from a = 0.0 to −2.0) and N0 (dashed lines; from N0 = 2.5 to 10) for different half-opening angles of the torus (red: 60°, green: 45°, blue: 30°). Left: type 1 AGN with i = 0°; Right: type 2 AGN with i = 90°. The grid lines are results for one random arrangement of clouds for the given set of parameters.
Current usage metrics show cumulative count of Article Views (full-text article views including HTML views, PDF and ePub downloads, according to the available data) and Abstracts Views on Vision4Press platform.
Data correspond to usage on the plateform after 2015. The current usage metrics is available 48-96 hours after online publication and is updated daily on week days.
Initial download of the metrics may take a while.