Fig. 11
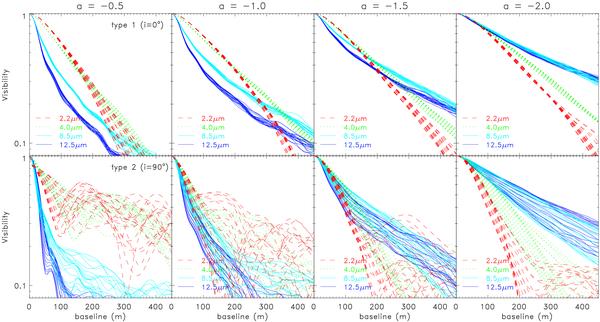
Dependence of the model visibility on the baseline for an AGN at 15 Mpc distance and a sublimation radius (=near-IR reverberation radius) of 0.025 pc. Each column represents simulation results for a different radial power law index a = −0.5, −1.0, −1.5, and −2.0, respectively, (top: type 1 AGN at i = 0°; bottom: type 2 AGN at i = 90°) with constant N0 = 7.5 and Rout = 150. In each panel, we show visibility curves at 2.2 (red-dashed lines), 4.0 (green-dotted lines), 8.5 (light-blue solid lines), and 12.5μm (dark-blue solid lines). The different lines per wavelength reflect the position-angle dependence of the visibility in steps of 10° and represent one particular random distribution of clouds.
Current usage metrics show cumulative count of Article Views (full-text article views including HTML views, PDF and ePub downloads, according to the available data) and Abstracts Views on Vision4Press platform.
Data correspond to usage on the plateform after 2015. The current usage metrics is available 48-96 hours after online publication and is updated daily on week days.
Initial download of the metrics may take a while.