Fig. 6
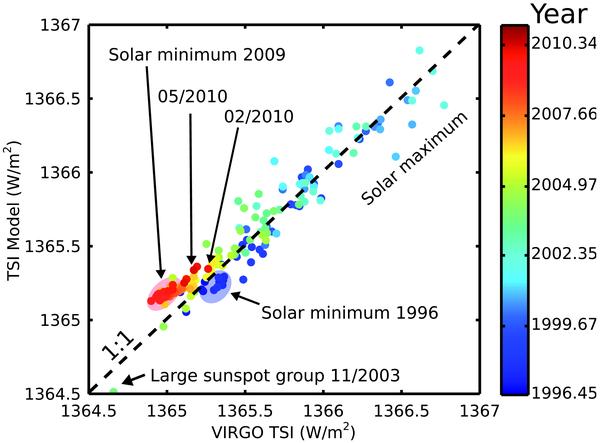
Our TSI reconstruction versus the observation (VIRGO TSI). The colors indicate the date. Black dashed is the 1:1 line. Our model represents the observed TSI before 2005, including the solar minimum in 1996, the solar maximum in 2002, and the decrease due to the large sunspot region in November 2003. The modeled values for the solar minimum in 2009 and for 2010 are higher than the observation.
Current usage metrics show cumulative count of Article Views (full-text article views including HTML views, PDF and ePub downloads, according to the available data) and Abstracts Views on Vision4Press platform.
Data correspond to usage on the plateform after 2015. The current usage metrics is available 48-96 hours after online publication and is updated daily on week days.
Initial download of the metrics may take a while.