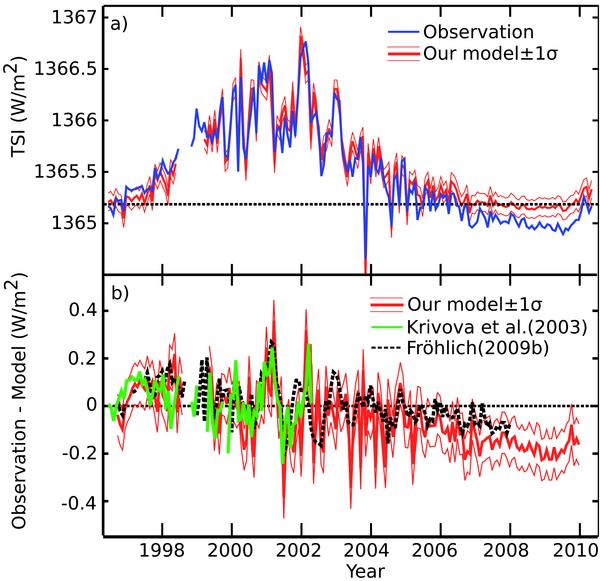
Fig. 4
Comparison of our TSI reconstruction based on Carrington rotation SOHO-MDI magnetograms and photograms with the observation (VIRGO TSI). The thin red lines show the upper and lower limits of our reconstruction considering the estimated uncertainties of the filling factors for sunspots and faculae. The data gap around 1998/1999 is due to SOHO “vacations”. a) Absolute values normalized to observation in 1996 marked with horizontal black dashed line. b) Difference between observation and the model. A zoom-in of the period 2004−2010 is plotted in Fig. 5. The differences between observation and the reconstructions of Krivova et al. (2003) (based on SOHO-MDI full-disk magnetograms and photograms) and Fröhlich (2009b) (based on MgII and photospheric sunspot indices) are also displayed.
Current usage metrics show cumulative count of Article Views (full-text article views including HTML views, PDF and ePub downloads, according to the available data) and Abstracts Views on Vision4Press platform.
Data correspond to usage on the plateform after 2015. The current usage metrics is available 48-96 hours after online publication and is updated daily on week days.
Initial download of the metrics may take a while.