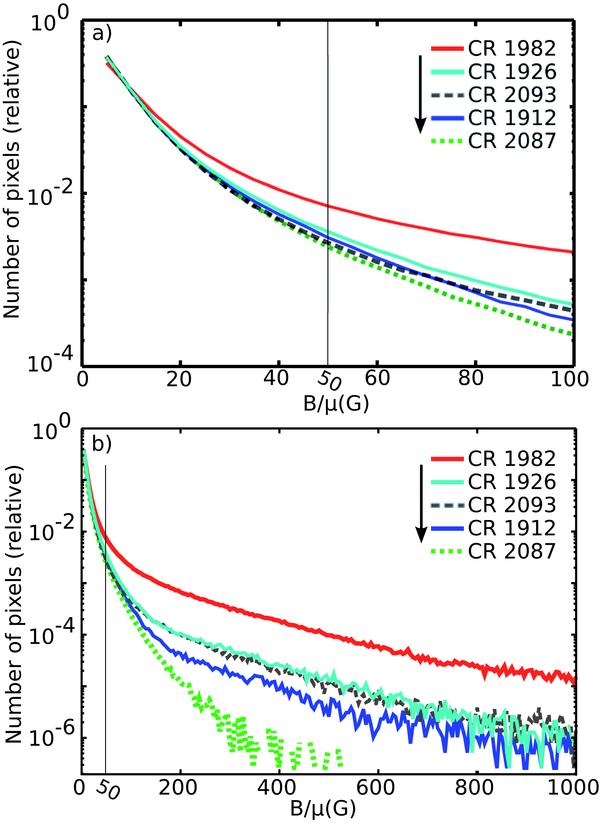
Fig. 3

Relative number of magnetogram pixels of synoptic charts. Lines from top to bottom are pixel numbers of CRs 1982 (October 2001, solar maximum), 1926 (August 1997, similar to CR 2093), 2093 (February 2010) 1912 (July 1996, solar minimum), and 2087 (August 2009, lowest values in solar minimum 2009)0. Only pixels with magnetic field strengths above the noise threshold at B/μ = 50 G (marked with vertical line) are considered to obtain filling factors. a) B/μ: 0−100 G, b) B/μ: 0–1000 G.
Current usage metrics show cumulative count of Article Views (full-text article views including HTML views, PDF and ePub downloads, according to the available data) and Abstracts Views on Vision4Press platform.
Data correspond to usage on the plateform after 2015. The current usage metrics is available 48-96 hours after online publication and is updated daily on week days.
Initial download of the metrics may take a while.


