Fig. 2
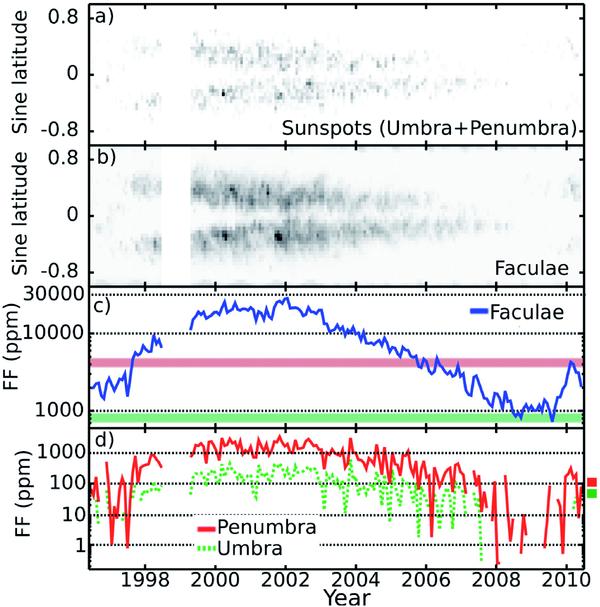
Results of filling factors (FF) for Carrington rotations 1910−2097 (June 1996–May 2010). The data gap around 1998/1999 is due to SOHO “vacations”. a) Sum of penumbra and umbra pixels as a function of latitude and time. b) Faculae as a function of latitude and time. c) Filling factors of faculae summed up over all latitudes. The red and green horizontal bars indicate the faculae filling factors in February 2010 and the solar minimum 2009, respectively. d) Filling factors of penumbra and umbra summed up over all latitudes. On the right hand side the estimated uncertainties for the penumbra and umbra are given as red and green bars.
Current usage metrics show cumulative count of Article Views (full-text article views including HTML views, PDF and ePub downloads, according to the available data) and Abstracts Views on Vision4Press platform.
Data correspond to usage on the plateform after 2015. The current usage metrics is available 48-96 hours after online publication and is updated daily on week days.
Initial download of the metrics may take a while.