Fig. 7
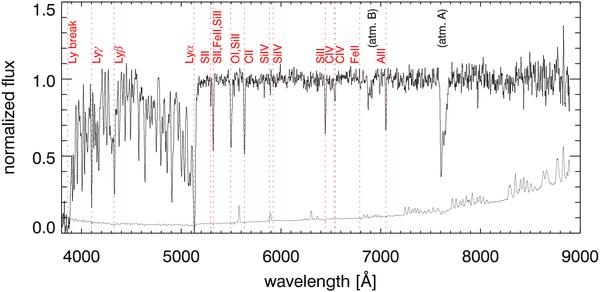
The spectrum taken with 300V grism, the two exposures have been combined to improve the S/N. The identified lines as well as the main atmospheric absorption bands are labelled. The line at the bottom shows the error spectrum. A color version of the figure is available in the online version of the article.
Current usage metrics show cumulative count of Article Views (full-text article views including HTML views, PDF and ePub downloads, according to the available data) and Abstracts Views on Vision4Press platform.
Data correspond to usage on the plateform after 2015. The current usage metrics is available 48-96 hours after online publication and is updated daily on week days.
Initial download of the metrics may take a while.