Fig. 6
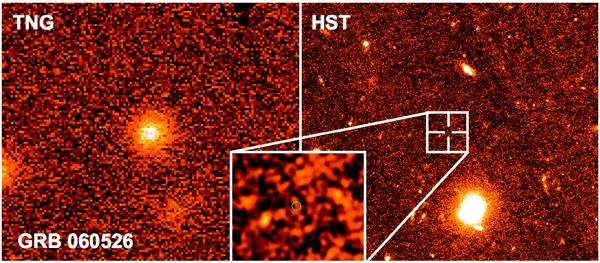
Left panel: an image from the TNG with the afterglow present. Right panel: the same region observed with HST/ACS and a zoom-in around the region of the afterglow. There is no source detected at the afterglow position itself down to a limit of F775W(AB) > 28.5. The brighter spot to the South-East in the zoomed HST image corresponds to the host candidate from the VLT mentioned in the text. A color version of the figure is available in the online version of the article.
Current usage metrics show cumulative count of Article Views (full-text article views including HTML views, PDF and ePub downloads, according to the available data) and Abstracts Views on Vision4Press platform.
Data correspond to usage on the plateform after 2015. The current usage metrics is available 48-96 hours after online publication and is updated daily on week days.
Initial download of the metrics may take a while.