Fig. 5
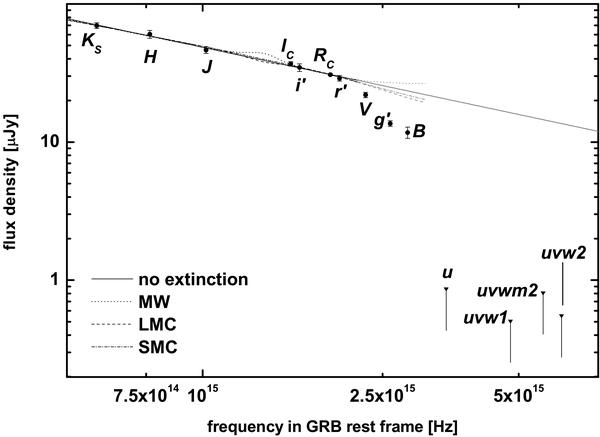
Spectral energy distribution of the afterglow of GRB 060526 in uvw2uvm2uvw1uBg′Vr′RCi′ICJHKS, and fits with no extinction (straight black line), MW extinction (dotted line), LMC extinction (dashed line) and SMC extinction (thick dash-dotted line). The fit with MW dust finds (unphysical) negative extinction, causing an “emissive component” instead of a 2175 Å absorption bump. Data beyond 2.2 × 10¹⁵ Hz (Vg′Buuvw1uvm2uvw2) were not included in the fit due to Lyman forest blanketing, the grey curves represent extrapolations. The extinction curves of Pei (1992) are not correctly defined beyond 3.2 × 10¹⁵ Hz. The UVOT UV filters are upper limits only, showing the strong flux decrease beyond the Lyman cutoff. The flux density scale is measured at the break time.
Current usage metrics show cumulative count of Article Views (full-text article views including HTML views, PDF and ePub downloads, according to the available data) and Abstracts Views on Vision4Press platform.
Data correspond to usage on the plateform after 2015. The current usage metrics is available 48-96 hours after online publication and is updated daily on week days.
Initial download of the metrics may take a while.