Fig. 4
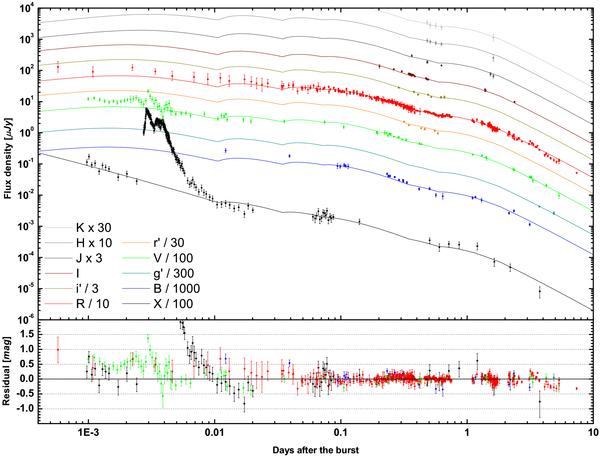
Fit to the light curve in X-ray and optical/NIR Vr′Ri′IJHKS bands including a total of five energy injections. Data before 500 s are excluded from the modelling, as well as the strong X-ray flare. The light curves have been offset by constant factors as given in the figure legend for better legibility. The Bg′ bands are affected by additional Lyman forest absorption and were not included in the fit. For the Bg′ bands, the model predictions have been multiplied by 0.50 and 0.55 respectively to match them with the data. The residuals are clearly improved in comparison to those plotted in Fig. 3, but short-timescale variations like the one at 0.7 days are still not fitted satisfactorily.
Current usage metrics show cumulative count of Article Views (full-text article views including HTML views, PDF and ePub downloads, according to the available data) and Abstracts Views on Vision4Press platform.
Data correspond to usage on the plateform after 2015. The current usage metrics is available 48-96 hours after online publication and is updated daily on week days.
Initial download of the metrics may take a while.