Fig. 2
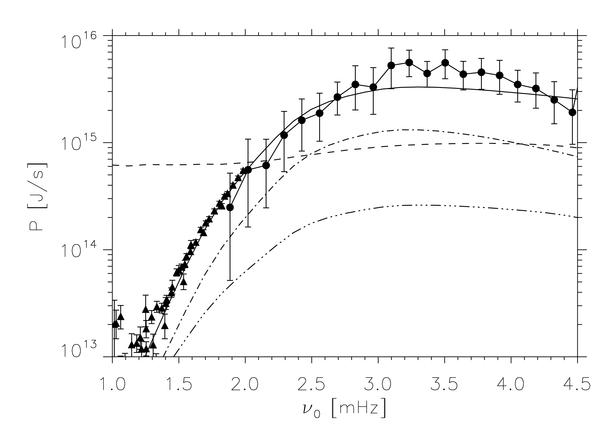
Solar p-mode excitation rates as a function of the frequency ν. The dots correspond to the observational data obtained by the GONG network, as derived by Baudin et al. (2005), and the triangles corresponds to observational data obtained by the GONG network as derived by Salabert et al. (2009) for ℓ = 0 to ℓ = 35. The dashed line corresponds to the computation of the excitation rates using the analytical approach together with a Lorentzien description of χkwithout any cut-off frequency. Note that this modeling is similar to that mentioned by Chaplin et al. (2005). The solid line corresponds to the computation of mode excitation rates using the semi-analytical approach as described in Sect. 4.1 and using a Lorentzian χk together with a cut-off frequency at ω = ωE. The dashed triple dot line corresponds to the analytical approach using a Lorentzian description of χk down to the cut-off frequency ωE. Finally, the dashed-dot line corresponds to a semi-analytical approach using a Gaussian description of χk. Note that both solid (Lorentzian χk) and dashed-dot (Gaussian χk) lines present a similar frequency dependance, and since both are computed using the 3D numerical simulations for the convective motions the differences only comes from the way turbulence is temporally correlated.
Current usage metrics show cumulative count of Article Views (full-text article views including HTML views, PDF and ePub downloads, according to the available data) and Abstracts Views on Vision4Press platform.
Data correspond to usage on the plateform after 2015. The current usage metrics is available 48-96 hours after online publication and is updated daily on week days.
Initial download of the metrics may take a while.