Fig. 7
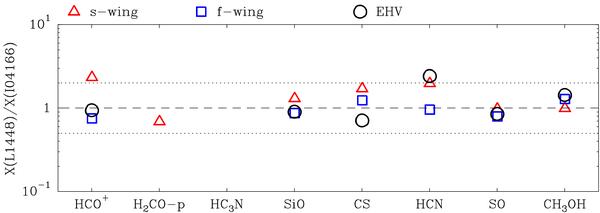
Ratio between the CO-normalized abundances derived for L1448 and I04166 in each outflow regime (symbols as in Fig. 6). Note how the points cluster around a value of 1. Only detections have been used. No HC3N data are presented due to its non detection in the I04166 outflow (at levels consistent with an abundance ratio of 1, see Table 3).
Current usage metrics show cumulative count of Article Views (full-text article views including HTML views, PDF and ePub downloads, according to the available data) and Abstracts Views on Vision4Press platform.
Data correspond to usage on the plateform after 2015. The current usage metrics is available 48-96 hours after online publication and is updated daily on week days.
Initial download of the metrics may take a while.