Fig. 6
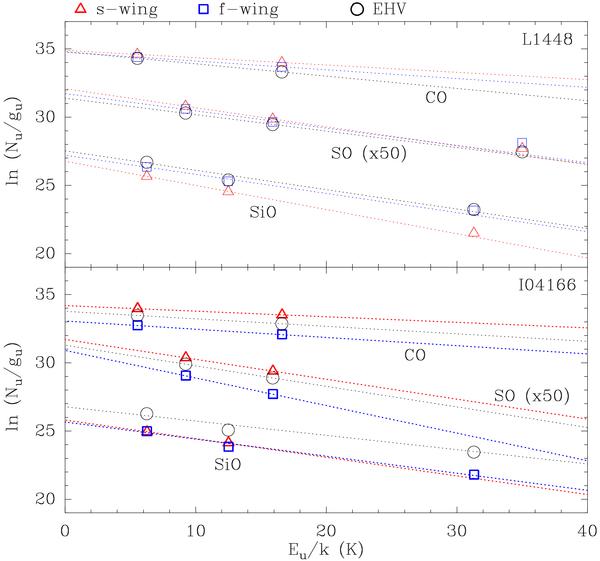
Population diagrams for CO, SiO, and SO in L1448 and I04166 illustrating the results from the excitation analysis. Red triangles, blue squares, and black circles represent s-wing, f-wing, and EHV values, respectively. The lines show the results from the least-squares fit described in the text and summarized in Table 3. The SO data have been multiplied by 50 for presentation purposes only.
Current usage metrics show cumulative count of Article Views (full-text article views including HTML views, PDF and ePub downloads, according to the available data) and Abstracts Views on Vision4Press platform.
Data correspond to usage on the plateform after 2015. The current usage metrics is available 48-96 hours after online publication and is updated daily on week days.
Initial download of the metrics may take a while.