Fig. 6
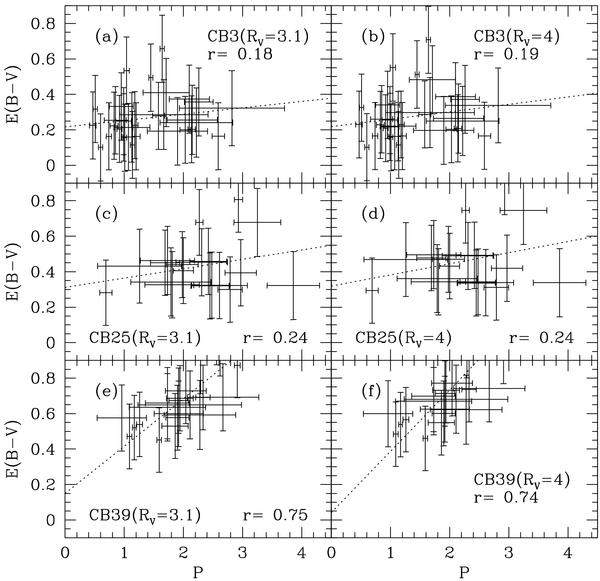
Extinction E(B − V) vs. polarization p for the clouds CB3, CB25, and CB39 for RV = 3.1 and 4.0 are shown. The dashed line in the figure represents the error-weighted least-square linear fit with p as independent variable, to the data points in Tables 1–3, considering the errors in both variables. The “error bars” shown in the figures represent errors in p (taken from Sen et al. 2000) and errors in E(B − V) as derived in the present work.
Current usage metrics show cumulative count of Article Views (full-text article views including HTML views, PDF and ePub downloads, according to the available data) and Abstracts Views on Vision4Press platform.
Data correspond to usage on the plateform after 2015. The current usage metrics is available 48-96 hours after online publication and is updated daily on week days.
Initial download of the metrics may take a while.