Fig. 9
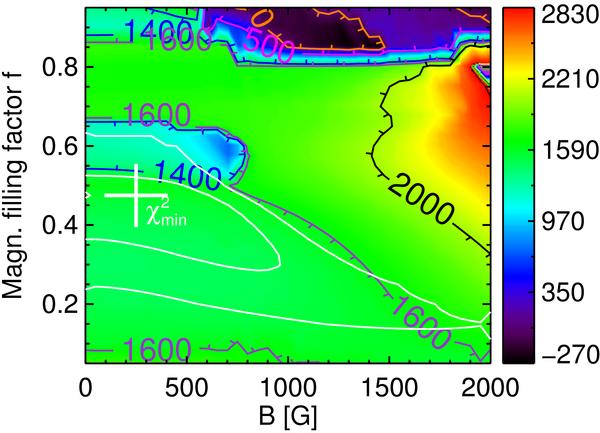
ΔT-map for 59 Vir, cool case. Difference in K between T1 and T2 indicated by colors indicated in legend on right. Contours drawn for ΔT = T1 − T2 = 0 K (orange), 500 K (magenta), 1400 K (blue), 1600 K (purple), and 2000 K (black). White contours indicate 3 and 5σ CLs. The large white plus indicates the point of overall best fit.
Current usage metrics show cumulative count of Article Views (full-text article views including HTML views, PDF and ePub downloads, according to the available data) and Abstracts Views on Vision4Press platform.
Data correspond to usage on the plateform after 2015. The current usage metrics is available 48-96 hours after online publication and is updated daily on week days.
Initial download of the metrics may take a while.