Fig. 1
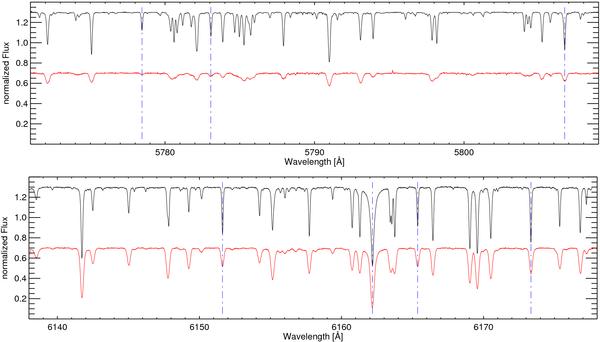
Sample CES spectra illustrating data quality. Continua are shifted by ±0.3 from unity for visibility. Blue dash-dotted vertical lines indicate spectral lines used for analysis. Upper panel: data set A. Upper black spectrum: sunlight reflected from Jupiter’s moon Ganymede; lower red spectrum: HD 68456 (F6V, vsini ≈ 10 km s-1). Lower panel: data set B. Upper black spectrum: inactive and slow rotator 61 Vir (G6V); lower red spectrum: active and faster rotator 59 Vir (G0V, vsini ≈ 6.5 km s-1).
Current usage metrics show cumulative count of Article Views (full-text article views including HTML views, PDF and ePub downloads, according to the available data) and Abstracts Views on Vision4Press platform.
Data correspond to usage on the plateform after 2015. The current usage metrics is available 48-96 hours after online publication and is updated daily on week days.
Initial download of the metrics may take a while.