| Issue |
A&A
Volume 522, November 2010
|
|
|---|---|---|
| Article Number | A12 | |
| Number of page(s) | 4 | |
| Section | Extragalactic astronomy | |
| DOI | https://doi.org/10.1051/0004-6361/201014724 | |
| Published online | 27 October 2010 | |
Research Note
Constraining extragalactic background light from TeV blazars
1
National Astronomical Observatories, Yunnan Observatory, Chinese Academy of
Sciences
Kunming
650011
PR China
e-mail: yangjp@ynao.ac.cn
2
Key Laboratory for the Structure and Evolution of Celestial
Objects, Chinese Academy of Sciences, Kunming
650011, PR
China
3
Yunnan Agricultural University, Kunming
650201, PR
China
Received:
2
April
2010
Accepted:
17
June
2010
Aims. Our goal is to research the upper limits to the extragalactic background light (EBL).
Methods. The upper limits to the extragalactic background light (EBL) are presented, using the Fermi and very high energy (VHE) spectra recently observed in TeV blazars. We use an assumption that the VHE intrinsic photon index cannot be harder than the Fermi index measured by the Fermi-LAT.
Results. These upper limits are compatible with ones given by most EBL models; however, the models of high EBL density are contradicted by TeV blazars.
Key words: gamma rays: galaxies / BL Lacertae objects: general / diffuse radiation
© ESO, 2010
1. Introduction
The diffuse extragalactic background light (EBL) consists of the sum of the starlight emitted by galaxies through the history of the Universe and includes an important contribution from the first stars. Direct measurements of the extragalactic background light (EBL) from the infrared (IR) to the ultraviolet (UV) are difficult because of the light pollution of bright foreground sources (see comprehensively reviewed measurements and implications of the cosmic infrared background, Hauser & Dwek 2001). The method of galaxy counts is used to estimate the EBL, but it only provides a lower limit owing to the unknown of unresolved sources. Various models for the EBL have been published: Salamon & Stecker (1998), Malkan & Stecker (1998, 2001), Stecker et al. (2006), Kneiske et al. (2002, 2004), Primack et al. (2005, 2008), Gilmore et al. (2008, 2009), Franceschini et al. (2008), Razzaque et al. (2009), Finke et al. (2010). These models include different degrees of complexity, observational constraints, and data inputs.
Absorption features imprinted on the very high-energy (VHE) spectra of distant extragalactic objects by background light photons provide an indirect approach to studying the EBL. Assuming an intrinsic gamma-ray spectrum, Stecker & de Jager (1993) and Stanev & Franceschini (1998) have constrained the EBL from the observed VHE spectra of blazars. Aharonian et al. (2006a) also discuss the upper limits on the background light at optical/near-infrared wavelengths based on the HESS observation of 1ES 1101-232. They assume that the intrinsic spectrum is not harder than Γint = 1.5 and put limits on EBL quite close to the lower limits by galaxy counts. The detailed studies of EBL shapes and blazar VHE spectra are also given by Mazin & Raue (2007), Schroedter (2005), and Finke & Razzaque (2009) where the same intrinsic spectrum is assumed for all blazars. In fact, blazars have different intrinsic spectra. The main handicap of this approach to limiting EBL is the uncertainty about the intrinsic spectrum of VHE.
To date, 35 AGN sources have been detected at TeV energies (E > 100 GeV)1. Their observed VHE spectra have power-law shapes with the index ΓVHE ≥ 2, in which distant sources have large ΓVHE, up to 4 (e.g. Acciari et al. 2009b; Albert et al. 2007b, 2008b; Aharonian 2006c, 2005a). Many of these sources have recently been detected at GeV energies by the Fermi Gamma-ray Space Telescope (Abdo et al. 2009, 2010b). Abdo et al. (2009) have extrapolated the Fermi spectrum up to 10 TeV assuming a single spectral index and taken it as an intrinsic spectrum of VHE ranges. Most breaks of the observed VHE spectra are consistent with the absorption predicted by the minimal EBL density model. For a TeV source, a break between the Fermi and VHE energy ranges might be caused by some internal or external factors. The internal factors include a break in the emitting particle distribution or an intrinsic absorption caused by strong optical-infrared radiation within the source (Donea & Protheroe 2003). The external factors usually refer to the cosmic attenuation effect. Furthermore, it is difficult to predict the intrinsic spectrum from simultaneous multi-wavelength observations because of the complexity of the VHE emission mechanism.
In this work, we assume that the Fermi spectral index measured by Fermi-LAT is the lower limit of intrinsic VHE spectral index for TeV blazars instead of single 1.5. In the other words, the photon index from the Fermi to VHE energy range is only softened except for the presence of a new component (Yang & Wang 2010) or monochromatic radiation fields within the source (Aharonian et al. 2009). The steeper intrinsic index assumed by us provides stronger constraints on the EBL intensity. All Fermi photon indexes of TeV sources are larger than the 1.5 with the exclusion of H 1426+428 ΓFer = 1.47. Moreover, when taking the differences of VHE emission between the different sources into account, this assumption is more reasonable than assuming Γint > 1.5. Recently, Georganopoulos et al. (2010) and Mankuzhiyil et al. (2010) have also used the extrapolation of the Fermi data as upper limits on intrinsic TeV spectra. Assuming the VHE intrinsic spectra corrected by EBL absorption is softer than the Fermi spectra, Prandini et al. (2010) find that the derived redshifts are might larger than true ones. It shows that their assumption is reliable.
Based on this assumption, we analyze the Fermi and VHE spectra of TeV blazars and give upper limits for the EBL intensity. In Sect. 2 we describe the method of calculating γ − γ absorption optical depth, τγγ(ϵ) and the EBL intensity, developed by Schroedter (2005) and Finke & Razzaque (2009). In Sect. 3 we apply the method to the TeV blazars with VHE and Fermi spectra and discuss the limits of these sources on the EBL.
2. The method
The VHE absorption of the EBL is caused by the pair production of photon-photon collisions.
The observed VHE flux is given by  (1)where
τ(Eγ) is the optical depth,
Eγ the observed γ-ray photon
energy, and
fint(Eγ) the
intrinsic flux.
(1)where
τ(Eγ) is the optical depth,
Eγ the observed γ-ray photon
energy, and
fint(Eγ) the
intrinsic flux.
For a VHE source at redshift ze, the optical depth of its
Eγ energy photon caused by the EBL is given
by ![\begin{eqnarray} \label{tau_detail} \tau(E_\gamma,z_{\rm e}) &=& c \pi r_{\rm e}^2 \left(\frac{m^2 c^4}{E_{\gamma}}\right)^2 \int_0^{z_{\rm e}} {\rm d}z {{\rm d}t \over {\rm d}z }\nonumber\\ &&\times \int_{\frac{ m^2c^4}{E_\gamma (1+z)}}^\infty {\rm d}\epsilon \cdot \epsilon^{-2} n_(\epsilon, z) \bar{\varphi}[s_0(\epsilon)], \end{eqnarray}](/articles/aa/full_html/2010/14/aa14724-10/aa14724-10-eq17.png) (2)where
n(ϵ,z) is the photon number density of the EBL with
energy ϵ at redshift z, re is
the classical electron radius,
s0 = ϵEγ / m2c4,
ϕ̅ [ s0(ϵ) ] is a function
given by Gould & Schréder (1967), and
(2)where
n(ϵ,z) is the photon number density of the EBL with
energy ϵ at redshift z, re is
the classical electron radius,
s0 = ϵEγ / m2c4,
ϕ̅ [ s0(ϵ) ] is a function
given by Gould & Schréder (1967), and
 is the
differential time of redshift given by
is the
differential time of redshift given by
![\begin{eqnarray} {\rm d}t/{\rm d}z = \frac{1}{H_0 (1+z)} \left[(1+z)^2 (1+\Omega_{\rm m} z) - z(z+2)\Omega_\Lambda \right]^{-1/2} . \end{eqnarray}](/articles/aa/full_html/2010/14/aa14724-10/aa14724-10-eq25.png) (3)Abdo et al. (2009) find that the intrinsic spectra of many
TeV sources can be described by a single power law across the Fermi and VHE energy ranges.
In fact, the observed Fermi and VHE spectral indices are different owing the EBL absorption.
Their difference ΔΓ increases with redshift. For example, M 87 and Cen A with low redshifts
have ΔΓ ≈ 0, while blazars with redshifts greater than 0.1 show ΔΓ ≥ 1.5. We assume that the
observed Fermi spectral index is the lower limit of intrinsic VHE spectral index, i.e.,
(3)Abdo et al. (2009) find that the intrinsic spectra of many
TeV sources can be described by a single power law across the Fermi and VHE energy ranges.
In fact, the observed Fermi and VHE spectral indices are different owing the EBL absorption.
Their difference ΔΓ increases with redshift. For example, M 87 and Cen A with low redshifts
have ΔΓ ≈ 0, while blazars with redshifts greater than 0.1 show ΔΓ ≥ 1.5. We assume that the
observed Fermi spectral index is the lower limit of intrinsic VHE spectral index, i.e.,
 . For some objects, multiple VHE
spectra have been observed in different flux states. We adopt the VHE spectra of their low
flux states to constrain the EBL.
. For some objects, multiple VHE
spectra have been observed in different flux states. We adopt the VHE spectra of their low
flux states to constrain the EBL.
TeV blazar sample.
Based on  , an upper limit on the optical
depth
τ(Eγ,ze)
is given by Finke & Razzaque
(2009)
, an upper limit on the optical
depth
τ(Eγ,ze)
is given by Finke & Razzaque
(2009) (4)and
its standard error τmax is given by
(4)and
its standard error τmax is given by
 (5)where
τ(Eγ,min,ze)
at the lowest energy Eγ,min of VHE observations
is estimated by the EBL model of Franceschini et al.
(2008).
(5)where
τ(Eγ,min,ze)
at the lowest energy Eγ,min of VHE observations
is estimated by the EBL model of Franceschini et al.
(2008).
Now we use
τmax(Eγ,ze)
to estimate an upper limit on the EBL number density. Following Schroedter (2005) and Finke &
Razzaque (2009) we take  for TeV sources
due to low redshift, where
H0 = 70 km s-1 Mpc-1. We assume the
monochromatic absorption of VHE photon Eγ by
the EBL at the energy
ϵ′ = 2m2c4 / (Eγ(1 + z)) ≈ 2m2c4 / Eγ
where the pair-production cross section reaches the highest value, and give an upper limit
on the EBL number density, n(ϵ,z). Using the Dirac
delta-function, we write n(ϵ,z) approximately as
for TeV sources
due to low redshift, where
H0 = 70 km s-1 Mpc-1. We assume the
monochromatic absorption of VHE photon Eγ by
the EBL at the energy
ϵ′ = 2m2c4 / (Eγ(1 + z)) ≈ 2m2c4 / Eγ
where the pair-production cross section reaches the highest value, and give an upper limit
on the EBL number density, n(ϵ,z). Using the Dirac
delta-function, we write n(ϵ,z) approximately as
 (6)Integrating
Eq. (2), we obtain
(6)Integrating
Eq. (2), we obtain  (7)where
ϕ̅(2) ≈ 1.787. The error of the EBL number density is given by
(7)where
ϕ̅(2) ≈ 1.787. The error of the EBL number density is given by
 (8)Finally,
the EBL intensity is given by
(8)Finally,
the EBL intensity is given by  (9)
(9)
3. Results and discussion
The EBL has two spectral humps with different origins. The blue hump at UV-Optical-NIR (near-infrared) wavelengths comes from stars. The red hump at MIR (mid-infrared) and FIR (far-infrared) wavelengths is from the absorption and re-emission of starlight by the interstellar medium. Therefore, the EBL includes the important information of star formation and evolution.
The TeV blazars used to constrain the EBL are listed in Table 1, where the spectra in the low-flux state are used to the utmost, since the 11-month averaged Fermi spectra are unlikely to correspond to the high state. Through calculation, we find that four blazars, 3C 66A, 0716+714, 3C 279, and PG 1553+113, give stronger constraints on the EBL density. Since other TeV blazars are consistent with all listed EBL models within the error range, we do not give their constraint. The EBL upper limits given by the spectra of four TeV blazars are shown in Fig. 1. The curves of several EBL models are also plotted in Fig. 1: Kneiske et al. (2004), Gilmore et al. (2009), Stecker et al. (2006), Finke et al. (2010), and Franceschini et al. (2008). In this work the calculated limits on the EBL at UV-Optical-NIR wavelengths are strong. For comparison, we also list the lower limits of the EBL from source counts (Madau & Pozzetti 2000). These calculated limits are inconsistent with the fast evolution model given by Stecker et al. (2006) in NIR-Optical wavelengths, but are still compatible with their baseline model. For this fast evolution model, the extinction of UV photons by the interstellar gas in galaxies is not considered, so the UV and Optical-NIR photon density might be overestimated. In fact, the observed gamma-ray hard spectra of H 2356-309 (z = 0.165) and 1ES 1101-232 (z = 0.186) by Aharonian et al. (2006a) suggest that an upper limit to the EBL at optical-NIR wavelengths is very close to the lower limit given by the integrated light of resolved galaxies. This implies that the EBL is more transparent to high-energy γ-rays than previously thought, and the contribution from all sources except starlight is less. Essey & Kusenko (2009) suggest a new interpretation of these observations. For distant blazars, the gamma-ray emission is dominated by the secondary photons, while the emission is from the primary photons for nearby blazars. Therefore, they argue that distant AGN would show no significant attenuation due to pair production on the EBL. Also, we should note that the redshift of 3C 66A, assumed to be z = 0.444, has a large uncertainty (Miller et al. 1978). If its redshift is less than 0.444, the upper limits obtained will be relaxed. The very bright nucleus makes the redshift of 0716+714 still uncertain. Stickel et al. (1993) repeated spectroscopic observations without obtaining the redshift, but they find that two neighboring galaxies have same redshifts of 0.26. However, the host galaxy detection gives a redshift of z = 0.31 (Nilsson et al. 2008). The redshift of PG 1553+113 also has a large uncertainty. Sbarufatti et al. (2005) derive a lower limit of z > 0.78. Sbarufatti et al. (2006) used the spectra of ESO VLT to give a limit of z > 0.09. Abdo et al. (2010a) constrain z ≤ 0.75 by combining Fermi and VHE gamma-ray data. Danforth et al. (2010) constrain its redshift as z ~ 0.4 − 0.6 by the Hubble Space Telescope. In this work, we adopt its redshift as z = 0.78. 3C 279 has a well-known redshift. In spite of a large redshift uncertainty for some objects, the models of high EBL density are denied by 3C 279.
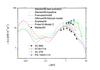 |
Fig. 1 Upper limits of the EBL given by 3C 66A, 0716+714, 3C 279 and PG 1553+113 under the assumption that the Fermi spectral index measured by Fermi-LAT can be used as an lower limit of the intrinsic VHE spectral index. Also plotted are several EBL models: the baseline and fast evolution models of Stecker et al. (2006) (dash, dot green curves, respectively), the model of Franceschini et al. (2008) (dash red curve), the fiducial model from Gilmore et al. (2009) (dot black curve), the best fit model from Kneiske et al. (2004) (dot-dash blue curve), and the Model C of Finke et al. (2010) (solid black curve). We also list the lower limits of EBL from source counts with upward triangles Madau & Pozzetti 2000). |
At low redshift, we assume the EBL do not evolve with redshift. However, the EBL is progressively generated by galaxies and active nuclei (AGN) during most of the Hubble time, particularly below z = 1. The evolution of their photon number density is a very complex function of time and frequency.
The uncertainty of the intrinsic VHE spectra is the main problem for TeV observations of blazars to limit the EBL. In the early works, all TeV blazars are assumed to have a lower limit of Γint = 1.5 based on some theories of particle acceleration and emission (e.g. Aharonian et al. 2006a). The same assumption was also adopted by Schroedter (2005) with the analysis of observed correlation between their ΓVHE and redshift. Stecker & Scully (2006) have derived a simple analytic approximation of the EBL absorption on the spectra of TeV blazars in the energy ranges of 0.2 < E < 2 TeV, and find that ΔΓ(z) = ΓVHE − Γint is a linear function of the redshift z in the range of 0.05 − 0.4. In this work, we assume that the Fermi spectral index measured by Fermi-LAT is the lower limit of the intrinsic VHE spectral index. In Fig. 2, we compare the redshift variation of ΓVHE − ΓFer and ΓVHE − 1.5 in the range of 0.03 < z < 0.4, excluding 3C 66A (z = 0.444), 3C 279 (z = 0.536), and PG 1553+113 (z = 0.78). It is shown that they have similar correlations with redshift, but the parameters fitting ΓVHE − ΓFer are more similar with the C and D of the baseline model given by Stecker & Scully (2006, 2010). In fact, the baseline model gives lower EBL density than the fast-evolution model does, and high EBL density models are disfavored by observations, such as in Aharonian et al. (2006a) and Georganopoulos et al. (2010). Most of the ΓVHE − ΓFer are less than the ΓVHE − 1.5, and smaller ΔΓ will provide stronger constraints on the EBL. If using Γint ≥ 1.5 to limit the EBL is reasonable, Γint ≥ ΓFer will be more feasible. 3C 66A and 0716+714 obviously deviate from the correlation shown in Fig. 2, which implies that the assumed redshift might be incorrect.
Since the simultaneous data of Fermi and VHE are less available nowadays, we only use non-simultaneous spectra. We also note that the upper limits of EBL density are depend strongly on the VHE photon index (see Eq. (4)). In fact, no significant spectral variability is observed in VHE bands. For example, PG 1553+113 has many VHE observations (Aharonian et al. 2006b, 2008; Albert et al. 2007f, 2009), and its photon index is very similar as observed by HESS and MAGIC (Abdo et al. 2010a). For PKS 2155-304, no significant spectral variability appears despite flux variation with a factor of two (Aharonian et al. 2009). For 1ES 1218+304, Acciari et al. (2010) find that the VHE spectral shape shows no change between the flare and quiescent state. Therefore our calculated results are meaningful when VHE spectra have no obvious variation.
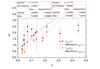 |
Fig. 2 Difference, ΔΓ, between the measured VHE and Fermi photon indices (or conventional limit 1.5) as a function of the redshift. Red inverted triangles denote the ΓVHE − ΓFer, and black triangles denote the ΓVHE − 1.5. The red dash line show the fitting of ΓVHE − ΓFer. |
We used the assumption of monochromatic absorption to calculate the EBL intensity at specified wavelengths. The result will be more than the actual case because of the EBL photons near specified wavelengths that also contribute the absorption. But, the method proposed by Schroedter (2005) and Finke & Razzaque (2009) does not assume the EBL spectrum and has an advantage over other methods because the EBL spectrum is not easily known. Future observations of Fermi and VHE spectra for blazars will provide strong constraints on the EBL.
Update see: http://www.mppmu.mpg.de/~rwagner/sources/.
Acknowledgments
We thank the referee for a very constructive report that helped improve our manuscript substantially. We acknowledge financial support from the National Natural Science Foundation of China 10673028 and 10778702, the National Basic Research Program of China (973 Program 2009CB824800), and the Policy Research Program of Chinese Academy of Sciences (KJCX2-YW-T24).
References
- Abdo, A. A., Ackermann, M., Ajello, M., et al. 2009, ApJ, 707, 1310 [NASA ADS] [CrossRef] [Google Scholar]
- Abdo, A. A., Ackermann, M., Ajello, M., et al. 2010a, ApJ, 708, 1310 [NASA ADS] [CrossRef] [Google Scholar]
- Abdo, A. A., Ackermann, M., Ajello, M., et al. 2010b, ApJ, 715, 429 [NASA ADS] [CrossRef] [Google Scholar]
- Acciari, V. A., Aliu, E., Beilicke, M., et al. 2008, ApJ, 684, L73 [NASA ADS] [CrossRef] [Google Scholar]
- Acciari, V. A., Aliu, E., Beilicke, M., et al. 2009a, ApJ, 693, L104 [NASA ADS] [CrossRef] [Google Scholar]
- Acciari, V. A., Aliu, E., Beilicke, M., et al. 2009b, ApJ, 690, L126 [NASA ADS] [CrossRef] [Google Scholar]
- Acciari, V. A., Aliu, E., Beilicke, M., et al. 2009c, ApJ, 695, 1370 [NASA ADS] [CrossRef] [Google Scholar]
- Acciari, V. A., Aliu, E., Beilicke, M., et al. 2010, ApJ, 709, L163 [NASA ADS] [CrossRef] [Google Scholar]
- Aharonian, F. A., Akhperjanian, A., Beilicke, M., et al. 2003, A&A, 403, 523 [NASA ADS] [CrossRef] [EDP Sciences] [Google Scholar]
- Aharonian, F. A., Akhperjanian, A., Beilicke, M., et al. 2005a, A&A, 436, L17 [NASA ADS] [CrossRef] [EDP Sciences] [Google Scholar]
- Aharonian, F. A., Akhperjanian, A., Beilicke, M., et al. 2005b, A&A, 430, 865 [NASA ADS] [CrossRef] [EDP Sciences] [Google Scholar]
- Aharonian, F. A., Akhperjanian, A., Beilicke, M., et al. 2006a, Nature, 440, 1018 [NASA ADS] [CrossRef] [PubMed] [Google Scholar]
- Aharonian, F. A., Akhperjanian, A., Beilicke, M., et al. 2006b, A&A, 448, L19 [NASA ADS] [CrossRef] [EDP Sciences] [Google Scholar]
- Aharonian, F. A., Akhperjanian, A., Beilicke, M., et al. 2008, A&A, 477, 481 [NASA ADS] [CrossRef] [EDP Sciences] [Google Scholar]
- Aharonian, F. A., Akhperjanian, A., Beilicke, M., et al. 2009, ApJ, 696, L150 [NASA ADS] [CrossRef] [Google Scholar]
- Albert, J., Aliu, E., Anderhub, H., et al. 2006, ApJ, 648, L105 [NASA ADS] [CrossRef] [Google Scholar]
- Albert, J., Aliu, E., Anderhub, H., et al. 2007a, ApJ, 666, L17 [NASA ADS] [CrossRef] [Google Scholar]
- Albert, J., Aliu, E., Anderhub, H., et al. 2007b, ApJ, 667, L21 [NASA ADS] [CrossRef] [Google Scholar]
- Albert, J., Aliu, E., Anderhub, H., et al. 2007c, ApJ, 663, 125 [NASA ADS] [CrossRef] [Google Scholar]
- Albert, J., Aliu, E., Anderhub, H., et al. 2007d, ApJ, 668, 862 [NASA ADS] [CrossRef] [Google Scholar]
- Albert, J., Aliu, E., Anderhub, H., et al. 2007e, ApJ, 662, 892 [NASA ADS] [CrossRef] [Google Scholar]
- Albert, J., Aliu, E., Anderhub, H., et al. 2007f, ApJ, 654, L119 [NASA ADS] [CrossRef] [Google Scholar]
- Albert, J., Aliu, E., Anderhub, H., et al. 2008, Science, 320, 1752 [NASA ADS] [CrossRef] [PubMed] [Google Scholar]
- Albert, J., Aliu, E., Anderhub, H., et al. 2009, A&A, 493, 467 [NASA ADS] [CrossRef] [EDP Sciences] [Google Scholar]
- Anderhub, H., Antonelli, L. A., Antoranz, P., et al. 2009, ApJ, 704, L129 [NASA ADS] [CrossRef] [Google Scholar]
- Danforth, C. W., Keeney, B. A., Stocke, J. T., Shull, J. M., & Yao, Y. 2010, ApJ, submitted [arXiv:1005.2191] [Google Scholar]
- Donea, A. C., & Protheroe, R. J. 2003, APh, 18, 377 [NASA ADS] [Google Scholar]
- Essey, W., & Kusenko, A. 2009, Astropart. Phys., 33, 85 [Google Scholar]
- Finke, J. D., & Razzaque, S. 2009, ApJ, 698, 1761 [NASA ADS] [CrossRef] [Google Scholar]
- Finke, J. D., Razzaque, S., & Dermer, C. D. 2010, ApJ, 712, 238 [NASA ADS] [CrossRef] [Google Scholar]
- Franceschini, A., Rodighiero, G., & Vaccari, M. 2008, A&A, 487, 837 [NASA ADS] [CrossRef] [EDP Sciences] [Google Scholar]
- Georganopoulos, M., Finke, J. D., & Reyes, L. C., 2010, ApJ, 714, L157 [NASA ADS] [CrossRef] [Google Scholar]
- Gilmore, R. C., Madau, P., Primack, J. R., & Somerville, R. S. 2008, in AIP Conf. Ser., 1085, 577 [Google Scholar]
- Gilmore, R. C., Madau, P., Primack, J. R., Somerville, R. S., & Haardt, F. 2009, MNRAS, 399, 1694 [Google Scholar]
- Gould, R. J., & Schréder, G. P. 1967, Phys. Rev., 155, 1404 [NASA ADS] [CrossRef] [Google Scholar]
- Hauser, M. G., & Dwek, E. 2001, ARA&A, 39, 249 [NASA ADS] [CrossRef] [Google Scholar]
- Kneiske, T. M., Mannheim, K., & Hartmann, D. H. 2002, A&A, 386, 1 [NASA ADS] [CrossRef] [EDP Sciences] [Google Scholar]
- Kneiske, T. M., Bretz, T., Mannheim, K., & Hartmann, D. H. 2004, A&A, 413, 807 [NASA ADS] [CrossRef] [EDP Sciences] [Google Scholar]
- Malkan, M. A., & Stecker, F. W. 1998, ApJ, 496, 13 [NASA ADS] [CrossRef] [Google Scholar]
- Malkan, M. A., & Stecker, F. W. 2001, ApJ, 555, 641 [NASA ADS] [CrossRef] [Google Scholar]
- Mankuzhiyil, N., Persic, M., & Tavecchio, F. 2010, ApJ, 715, L16 [NASA ADS] [CrossRef] [Google Scholar]
- Mazin, D., & Raue, M. 2007, A&A, 471, 439 [NASA ADS] [CrossRef] [EDP Sciences] [Google Scholar]
- Miller, J. S., French, H. B., & Hawley, S. A., 1978, in Pittsburgh Conference on BL Lac Objects, ed. A. M. Wolfe (Pittsburgh: Univ. Pittsburgh), 176 [Google Scholar]
- Madau, P., & Pozzetti, L. 2000, MNRAS, 312, 9 [Google Scholar]
- Nilsson, K., Pursimo, T., Sillanpää, A., Takalo, L. O., & Lindfors, E. 2008, A&A, 487, L29 [NASA ADS] [CrossRef] [EDP Sciences] [Google Scholar]
- Prandini, E., Bonnoli, G., Maraschi, L., Mariotti, M., & Tavecchio, F. 2010, MNRAS, 405, L76 [NASA ADS] [CrossRef] [Google Scholar]
- Primack, J. R., Bullock, J. S., & Somerville, R. S. 2005, in High Energy Gamma-Ray Astronomy, ed. F. A. Aharonian, H. J. Völk, & D. Horns, AIP Conf. Ser., 745, 23 [Google Scholar]
- Primack, J. R., Gilmore, R. C., & Somerville, R. S. 2008, in AIP Conf. Ser., 1085, 71 [Google Scholar]
- Razzaque, S., Dermer, C. D., & Finke, J. D. 2009, ApJ, 697, 483 [NASA ADS] [CrossRef] [Google Scholar]
- Salamon, M. H., & Stecker, F. W. 1998, ApJ, 493, 547 [NASA ADS] [CrossRef] [Google Scholar]
- Sbarufatti, B., Treves, A., & Falomo, R. 2005, ApJ, 635, 173 [NASA ADS] [CrossRef] [Google Scholar]
- Sbarufatti, B., Treves, A., Falomo, R., et al. 2006, AJ, 132, 1 [NASA ADS] [CrossRef] [Google Scholar]
- Schroedter, M. 2005, ApJ, 628, 617 [NASA ADS] [CrossRef] [Google Scholar]
- Stanev, T., & Franceschini, A. 1998, ApJ, 494, L159 [NASA ADS] [CrossRef] [Google Scholar]
- Stecker, F. W., & de Jager, O. C. 1993, ApJ, 415, L71 [NASA ADS] [CrossRef] [Google Scholar]
- Stecker, F. W., & Scully, S. T. 2006, ApJ, 652, L9 [NASA ADS] [CrossRef] [Google Scholar]
- Stecker, F. W., & Scully, S. T. 2010, ApJ, 709, L124 [NASA ADS] [CrossRef] [Google Scholar]
- Stecker, F. W., Malkan, M. A., & Scully, S. T. 2006, ApJ, 648, 774 [NASA ADS] [CrossRef] [Google Scholar]
- Stickel, M., Fried, J. W., & Kuehr, H. 1993, A&AS, 98, 393 [Google Scholar]
- Tagliaferri, G., Foschini, L., Ghisellini, G., et al. 2008, ApJ, 679, 1029 [NASA ADS] [CrossRef] [Google Scholar]
- Yang, J., & Wang, J. 2010, A&A, 511, A11 [NASA ADS] [CrossRef] [EDP Sciences] [Google Scholar]
All Tables
All Figures
|
Fig. 1 Upper limits of the EBL given by 3C 66A, 0716+714, 3C 279 and PG 1553+113 under the assumption that the Fermi spectral index measured by Fermi-LAT can be used as an lower limit of the intrinsic VHE spectral index. Also plotted are several EBL models: the baseline and fast evolution models of Stecker et al. (2006) (dash, dot green curves, respectively), the model of Franceschini et al. (2008) (dash red curve), the fiducial model from Gilmore et al. (2009) (dot black curve), the best fit model from Kneiske et al. (2004) (dot-dash blue curve), and the Model C of Finke et al. (2010) (solid black curve). We also list the lower limits of EBL from source counts with upward triangles Madau & Pozzetti 2000). |
| In the text | |
|
Fig. 2 Difference, ΔΓ, between the measured VHE and Fermi photon indices (or conventional limit 1.5) as a function of the redshift. Red inverted triangles denote the ΓVHE − ΓFer, and black triangles denote the ΓVHE − 1.5. The red dash line show the fitting of ΓVHE − ΓFer. |
| In the text | |
Current usage metrics show cumulative count of Article Views (full-text article views including HTML views, PDF and ePub downloads, according to the available data) and Abstracts Views on Vision4Press platform.
Data correspond to usage on the plateform after 2015. The current usage metrics is available 48-96 hours after online publication and is updated daily on week days.
Initial download of the metrics may take a while.