Free Access
Fig. 2
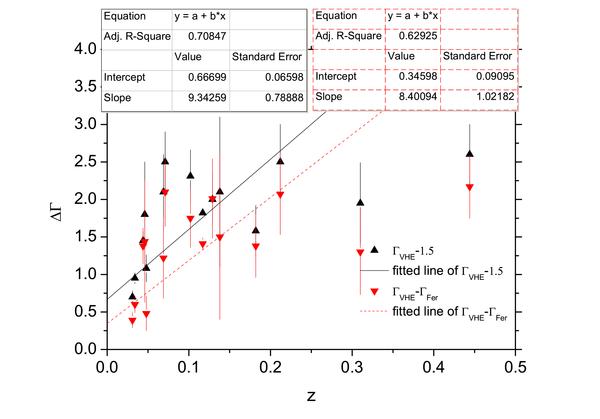
Difference, ΔΓ, between the measured VHE and Fermi photon indices (or conventional limit 1.5) as a function of the redshift. Red inverted triangles denote the ΓVHE − ΓFer, and black triangles denote the ΓVHE − 1.5. The red dash line show the fitting of ΓVHE − ΓFer.
Current usage metrics show cumulative count of Article Views (full-text article views including HTML views, PDF and ePub downloads, according to the available data) and Abstracts Views on Vision4Press platform.
Data correspond to usage on the plateform after 2015. The current usage metrics is available 48-96 hours after online publication and is updated daily on week days.
Initial download of the metrics may take a while.