Free Access
Fig. 2
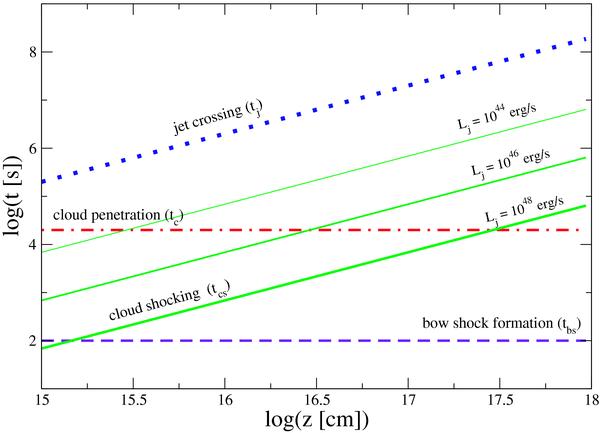
The jet crossing (blue dotted line), cloud penetration (red dot-dashed line), bow-shock formation (violet dashed line), and cloud shocking (green solid lines) times are plotted; all of them have been calculated using the values given in Table 1. The time tcs is plotted for Lj = 1044, 1046, and 1048 erg s-1.
Current usage metrics show cumulative count of Article Views (full-text article views including HTML views, PDF and ePub downloads, according to the available data) and Abstracts Views on Vision4Press platform.
Data correspond to usage on the plateform after 2015. The current usage metrics is available 48-96 hours after online publication and is updated daily on week days.
Initial download of the metrics may take a while.