Free Access
Fig. 8
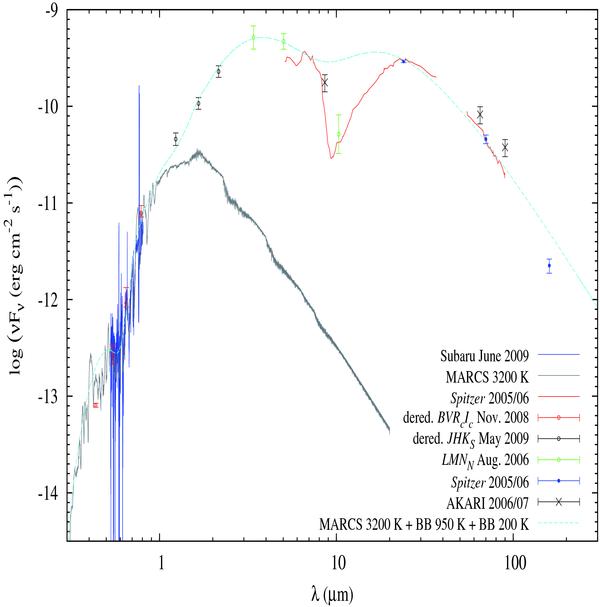
Spectral energy distribution for V4332 Sgr. Observational points are taken from different sources as listed in the text. Our attempt to fit the observed SED is shown with a dashed line.
Current usage metrics show cumulative count of Article Views (full-text article views including HTML views, PDF and ePub downloads, according to the available data) and Abstracts Views on Vision4Press platform.
Data correspond to usage on the plateform after 2015. The current usage metrics is available 48-96 hours after online publication and is updated daily on week days.
Initial download of the metrics may take a while.