Fig. 4
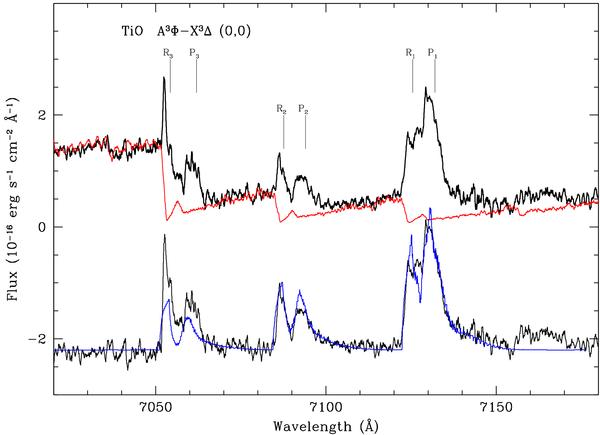
Upper part: the observed spectrum in the vicinity of the TiO γ (0, 0) band (black line) and a synthetic model spectrum for Teff = 3200 K and log g = 0.0 (red line). Lower part: result of subtraction of the synthetic stellar flux from the observed one (black line) and the model emission calculated as explained in the text (blue line).
Current usage metrics show cumulative count of Article Views (full-text article views including HTML views, PDF and ePub downloads, according to the available data) and Abstracts Views on Vision4Press platform.
Data correspond to usage on the plateform after 2015. The current usage metrics is available 48-96 hours after online publication and is updated daily on week days.
Initial download of the metrics may take a while.