Fig. 8
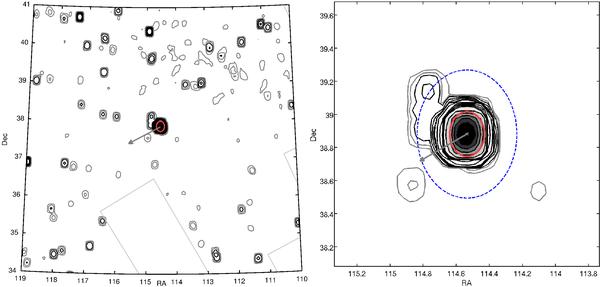
Left panel: contour plot of a large area centered on NGC 2419. Right panel: blow-up of the contour plot centered on NGC 2419. In both panels the isodensity lines are drawn at levels of 1,2,3,5,7,8,10,20,40,····σbkg above the mean weighted background level. The 1σbkg and 2σbkg contours are drawn in light gray, the higher levels are drawn in black. The solid gray arrow points towards the Galactic Center. The gray solid line marks the edge of the SDSS survey area. The red solid circle shows the King tidal radius. The blue dashed circle shows the Jacobi radius.
Current usage metrics show cumulative count of Article Views (full-text article views including HTML views, PDF and ePub downloads, according to the available data) and Abstracts Views on Vision4Press platform.
Data correspond to usage on the plateform after 2015. The current usage metrics is available 48-96 hours after online publication and is updated daily on week days.
Initial download of the metrics may take a while.