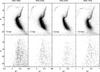
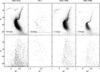
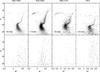
Fig. 2
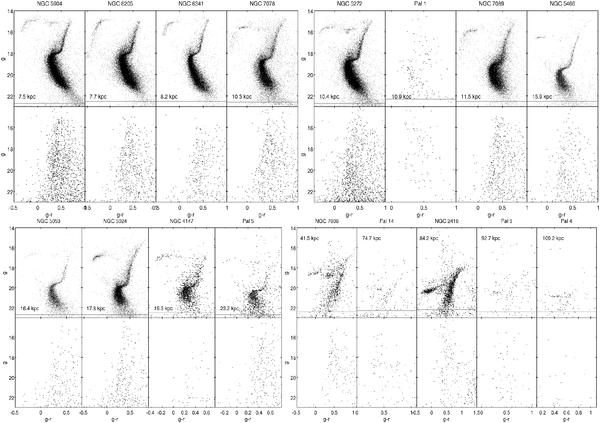
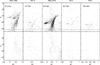
Top rows: color–magnitude diagrams of all GCs in our sample in order of increasing distance from the Sun. The distances from Harris (1996) are printed in each CMD. The gray horizontal line marks the magnitude limit for each cluster. Bottom rows: color–magnitude diagrams of a random field in the vicinity of the cluster (see text for details).
Current usage metrics show cumulative count of Article Views (full-text article views including HTML views, PDF and ePub downloads, according to the available data) and Abstracts Views on Vision4Press platform.
Data correspond to usage on the plateform after 2015. The current usage metrics is available 48-96 hours after online publication and is updated daily on week days.
Initial download of the metrics may take a while.