| Issue |
A&A
Volume 522, November 2010
|
|
|---|---|---|
| Article Number | A69 | |
| Number of page(s) | 5 | |
| Section | Astronomical instrumentation | |
| DOI | https://doi.org/10.1051/0004-6361/201014270 | |
| Published online | 04 November 2010 | |
First characterization of Jbel Aklim in Moroccan Anti-Atlas as a potential site for the E-ELT
Meteorological parameters and seeing measurements
1
High Energy Physics and Astrophysics Laboratory (LPHEA), Université Cadi
Ayyad, Faculté des Sciences Semlalia, Av. Prince My Abdellah, BP 2390
Marrakesh, Morocco
e-mail: zouhair@ucam.ac.ma
2
Département de Physique Appliquée, Facultée des Sciences et
Techniques, UCAM,
BP 549
Marrakesh,
Morocco
3
École Normale Supérieure, route Essaouira, Laboratoire optique et
optoélectronique, 4000
Marrakesh,
Morocco
Received:
17
February
2010
Accepted:
11
July
2010
Context. In the framework of the European Extremely Large Telescope project (E-ELT), a survey of prospective sites was launched by the European Southern Observatory (ESO) to select a site to host the next generation of optical telescopes of 42 m diameter, i.e., the E-ELT. The Moroccan Anti-Atlas (Jbel Aklim) was selected as one of these sites.
Aims. We present an analysis of meteorological parameters and seeing measurements at Aklim, the Moroccan prospective site of the E-ELT project.
Methods. We initiated a preliminary campaign to measure the astronomical seeing at Jbel Aklim using a differential image motion monitor (DIMM) instrument. We installed a weather station 2 m above the ground level to measure meteorological parameters such as temperature, relative humidity, pressure, wind speed, and wind direction.
Results. We present data obtained by the DIMM monitor during 105 nights. The median and mean values of the seeing for the entire period of observation are 0.72′′ and 0.79′′, respectively, with a standard deviation of 0.31′′. The best value of the seeing obtained during this period is 0.30′′. A seasonal analysis of meteorological parameters are presented. We also used data from the National Center for Environmental Prediction/National Center for Atmospheric Research reanalysis database (NCEP/NCAR) to derive more information about the long-term evolution of atmospheric parameters at Aklim site.
Conclusions. Our preliminary results indicate that Aklim has indeed good conditions for conducting astronomical observations and could be a site to host a future astronomical observatory, even of E-ELT dimensions.
Key words: atmospheric effects / site testing / surveys
© ESO, 2010
1. Introduction
In 2006, the European Southern Observatory (ESO) launched a worldwide search for potential astronomical sites to host the E-ELT. The qualification of an astronomical site consists of determining many parameters such as cloud cover, water vapor content, wind speed, seeing, and other atmospheric parameters. According to the report by Erasmus & van Rooyen (2006), the climate and topography of Morocco appear to be favorable for a telescope site. Based on climatic and topographic data, Jbel Aklim situated in the Anti-Atlas mountains was selected as a prospective location for the E-ELT. We present a preliminary campaign to assess more fully the appropriateness of this site.
A DIMM instrument was installed on a 1.2 m pillar on 2007 February 23 to measure the seeing. A weather station of type WS 2-550 was installed on 2008 April 16, at 2 m above the ground, to measure meteorological parameters at Jbel Aklim such as temperature, pressure, relative humidity, wind speed, wind direction, and precipitation. We also used data from the National Center for Environmental Prediction/National Center for Atmospheric Research NCEP/NCAR reanalysis database to establish the longterm trend of meteorological parameters at Aklim site. This database provides four data per day (0 h, 6 h, 12 h, and 18 h universal time) at seventeen pressure levels. Through numerous papers, it has been shown that the NCEP/NCAR reanalysis database is robust and reliable and correlates very well with meteorological balloon measurements, NCEP/NCAR reanalysis database (Kalnay et al. 1996).
In the first part of this paper, we present meteorological data obtained during a measurement campaign performed between May 2008 and April 2009. In the second part, we present seeing measurements recorded over 105 nights between February 2007 and September 2008.
2. Selection strategy of Aklim site
The testing of a range of prospective sites in Morocco started in 1987, Benkhaldoun et al. (1993) presenting a test of the Oukaimeden site, in the High-Atlas mountains. The photometric, meteorological, and astro-climatological study of that site provided promising results. However, the pre-selection of Oukaimeden for the E-ELT project was discarded because of it being affected by light pollution despite its excellent astro-climatological qualities (Benkhaldoun et al. 1993, 2005; Hill et al. 1994; Jabiri et al. 2000; Ziad et al. 2001; Benkhaldoun 2002).
A site-testing campaign in the framework of the E-ELT project was carried out at Jbel Aklim, which is located in the Moroccan Anti-Atlas mountains, at the geographical coordinates 30°7′39′′ north and 08°18′31′′ west. It is a large plateau, at an altitude of 2390 m, about one hundred kilometers east of the Atlantic coast line, 160 km from the town of Agadir, and 480 km south of Marrakesh city.
The determination of cloud cover and water vapor content in the area of Morocco and the Canary Islands was the subject of a report by Erasmus & van Rooyen (2006). By using seven years of satellite data of cloud cover and water vapor content in Morocco and southern Spain and also La Palma ground-based observations, they concluded that the fraction of clear night-time over the Aklim area is 75%, and that the climate of the region surrounding Aklim is favorable enough to suggest that a potential site may be found in that area.
Average wind vectors and velocity iso-values featured in the map from 0° to 18° W and from 22° to 40° N are illustrated in Fig. 1. The data taken from the NCEP/NCAR reanalysis are an average of an 11 year period from 1997 to 2007 of the wind at Aklim’s altitude. We can see that the predominant winds are from the west southwest (WSW) (from the Atlantic Ocean).
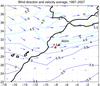 |
Fig. 1 Wind vectors and wind velocity iso-values featured on the map from 18° W to 0° and from 22° N to 40° N, corresponding to Aklim’s altitude. The wind is averaged over an 11 year period, from 1997 to 2007. The star in the map is Aklim’s location. |
A cross-section of a portion of the Anti-Atlas plateau is illustrated in Fig. 2. The Atlantic ocean is at the left side of the figure and Jbel Aklim is the highest summit at the right. We can see that there is no higher summit than Aklim between the ocean and Jbel Aklim, hence we can assume that the wind coming from the ocean side blows in a laminar regime. In addition, the Aklim mountain lies in a dry and desert region, where the climate is arid with low rainfall and there isno light pollution. The Anti-Atlas mountains were then selected, in particular Jbel Aklim, as a candidate to be considered in the E-ELT site testing campaign.
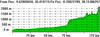 |
Fig. 2 Cross-section of the Anti-Atlas plateau (east-west cut from long: 9.63W and lat: 30.41N to respectively 8.40W and 30.15N). The summit selected is the highest summit at the right of the figure and the Atlantic ocean is at the left. |
3. Meteorological statistics
Ground-level measurement of meteorological parameters are of major importance in site pre-selection. It allows us to characterize the effect of the Earth surface on the telescope performance. The meteorological measurements, presented here, were recorded over one year, from May 2008 to April 2009, using a wireless automatic weather station WS 2-550 from “La Crosse Technology”. The resolutions are 0.1°C for the temperature, 0.1 km/h for wind speed, 5° for wind direction, 0.1% for relative humidity, and 0.3 mm for the precipitations. The outside sensors of the station are installed at 2 m above the ground. The instantaneous measurements are performed every 2 min and sampled every 5 min. In February, there was a breakdown of the meteorological station.
In the following paragraph we present the results of the meteorological campaign. To compare our one-year data with those over a longer term period, we used the NCEP/NCAR reanalysis database. In the statistical procedure of the NCEP/NCAR data, we simply averaged monthly averages. Since, the pressure level surrounding Aklim’s altitude is about 767 mbar we used an extrapolation to this level using a linear relation of meteorological data: X767 mb = X700 mb − 0.45(X700 mb − X850 mb), where X767 mb is a meteorological parameter measured at Aklim’s altitude (Bounhir et al. 2008).
Monthly variations in the temperature measured with the meteorological station are reported in Fig. 3. One year (2008 − 2009) average daytime, night-time and daily mean variations in the temperature are plotted. The monthly averages were derived for daytime from 10h:00mn UT to 16h:00mn UT, and night-time from 22h:00mn UT to 04h:00mn UT, and daily from 0 h UT to 24 h UT data, following the recipe of Jabiri et al. (2000) and Lombardi et al. (2006).
In the same figure, we have plotted the NCEP/NCAR reanalysis monthly mean variation of the temperature from 1998 to 2008. We note the seasonal variation in the temperature where the coldest months last from October to March and the hottest ones from April to September. The daytime and night-time mean temperature are 14.6°C and 11.6°C, respectively. The measured temperature over that year can be considered as typical of the Aklim site because of the good agreement with the 11 year average of the NCEP/NCAR reanalysis temperature. The mean value given by NCEP/NCAR is 11.06°C versus 12.72°C measured at ground level. We should also mention that the daily temperature measured with the meteorological station and the coincident NCEP/NCAR reanalysis daily temperature correlates with a correlation coefficient of 0.97.
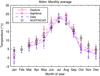 |
Fig. 3 Monthly mean variation in the temperature measured at 2 m above the ground. The dash-dot, solid, and dashed lines represents, the daytime, night-time, and daily data respectively. Monthly mean variation in the temperature over 11 years (1998 − 2008) obtained form the NCEP/NCAR reanalysis in dotted line are represented to compare the two results. |
Monthly variations in the daytime, night-time, and daily relative humidity are illustrated in Fig. 4. The mean and median values are 38% and 31%, respectively. The humid months last from November to April and the driest ones from May to October.
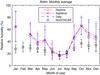 |
Fig. 4 Monthly mean variation in relative humidity measured at ground level by the meteorological station. The dash-dot, solid, and dashed lines represents, respectively, the daytime, night-time, and daily data. Monthly mean variation in the relative humidity over 11 years (1998 − 2008) obtained from the NCEP/NCAR reanalysis are in dotted line. |
We can see that the humidity values measured with the meteorological station are highest than those given by the NCEP/NCAR reanalysis database, although the seasonal shape is preserved. The mean value given by NCEP/NCAR (11 years of data) is 27.97% versus 38% measured at ground level. The main reason for this difference is that the past year was particularly rainy especially between October 2008 and April 2009. The last annual precipitation (2008 − 2009) at Jbel Aklim was 92.7 mm. We note that the NCEP/NCAR reanalysis provides an average humidity value of 34% for the period during which the meteorological station was operating. The correlation coefficient between relative humidity coincident daily values measured and provided by the NCEP/NCAR reanalysis is 0.84.
Monthly daytime, night-time, and daily variations in wind speed are illustrated in Fig. 5 where we note that there is no significant seasonal effect. The daily mean wind speed at Jbel Aklim is 6.43 m/s and the maximum monthly mean velocity computed during the measurement campaign is 9.13 m/s.
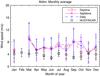 |
Fig. 5 Monthly mean variation in wind speed measured at ground level by the meteorological station. The dash-dot, solid, and dashed lines represents, respectively, the daytime, night-time and daily data. Monthly mean variation of the wind speed over 11 years (1998 − 2008) obtained form the NCEP/NCAR reanalysis are in dotted line. |
The NCEP/NCAR database gives an average wind velocity of 4 m/s for the eleven year period and an average wind velocity of 6.2 m/s for the operating period of the meteorological station. We can then conclude that the study period was particularly windy. The discrepancies in Fig. 5 between measured and NCEP/NCAR provided wind velocity are mainly due to local orography effects that are hardly taken into account in global circulation models. The correlation coefficient between the coincident wind speed daily values, measured and provided by the NCEP/NCAR, is indeed very weak R = 0.54.
The prevailing wind direction given by the NCEP/NCAR reanalysis (11 year average) is west southwest, Fig. 6 right side while the wind rose at the meteorological station (Fig. 6 left side) shows that all directions are indicated due to local ground orography. However, there are predominant directions west and southwest that correspond to winds coming from the Atlantic ocean.
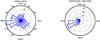 |
Fig. 6 Left side: wind rose measured at 2 m above ground level at Jbel Aklim. Right side: wind rose obtained from the NCEP/NCAR reanalysis data over the pixel containing Aklim site for eleven year average. |
Wind speed, temperature, and relative humidity statistical results of the whole data at Aklim site are summarized in Table 1.
Daytime, night-time, and daily statistical results of the wind speed, temperature, and relative humidity for whole data set at Aklim site.
4. Seeing measurement at Aklim site
To characterize the optical quality of the atmosphere above Jbel Aklim, a preliminary measurement campaign was held from February 2007 to September 2008. About 67 408 values of seeing were measured during that period using a DIMM aperture.
The DIMM theory has been explained well in many papers (Martin 1987; Sarazin & Roddier 1990; Tokovinin 2002; Benkhaldoun et al. 2005). It consists of two sub-apertures of a small telescope that form two images of a star on a CCD camera. The seeing is estimated from the variance in the differential motion of the images. These images are obtained by using a mask with two holes where a prism is placed in one of them to form a second image on the camera detector. The technical parameters of the DIMM used in the measurement campaign are summarized in Table 2.
Technical parameters of the DIMM aperture used in the measurement campaign.
From February 2007 to September 2008, we measured the seeing over thirteen months. Many breakdowns occurred during that period because of technical problems. Table 3 summarizes the seeing statistics during the measurement campaign. The monthly mean, median, standard deviation, number of observing nights, and number of seeing measurements are shown.
Monthly statistics of the seeing at Aklim site obtained from February 2007 to September 2008.
To study the seeing seasonal behavior, we defined the dry season to be from May to October and wet one from November to April. The median seeing during the wet seasons is 0.68′′ and during the dry seasons it increases to 0.84′′. The minimum median seeing is 0.58′′, recorded in March 2007, and the maximum median seeing is 0.95′′, recorded in May 2008. The histogram of seeing values and cumulative frequency during 105 nights of the campaign is given in Fig. 7. The median and mean values of the seeing for the entire period of observation are 0.72′′ and 0.79′′, respectively. The best seeing measured was 0.3′′.
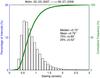 |
Fig. 7 Histogram and cumulative frequency of all seeing data at Aklim site. Global statistics of 105 observing nights from February 2007 to September 2008. |
In Table 4, we compared Aklim to other famous sites in terms of seeing. From this table, we can deduce that the seeing at Aklim site is favorable for astronomical observations.
Median astronomical seeing at some astronomical observatories.
5. Conclusions
As part of the search for a site to host the future E-ELT, we have carried out a campaign to characterize the Aklim site in Morocco which is one of four possible sites pre-selected by ESO.
We have analyzed meteorological parameters measured by a weather station, i.e., temperature, relative humidity, and wind speed and direction. The measurements of 12.72 °C, 37.68%, and 6.43 m/s were found to be respectively, the mean temperature, relative humidity, and wind speed. The predominant wind directions are west and south-west.
To define a long-term trend in the meteorological parameters, we have also used an 11 year average of NCEP/NCAR reanalysis data over Aklim. From this comparison, the period of our in-situ measurements was found to be typical in terms of temperature but particularly windy and humid than in other years.
We have also presented the astronomical seeing measurements for 105 observing nights obtained between February 2007 and September 2008. The median and mean values of the seeing for the entire period of observation are 0.72′′ and 0.79′′, respectively.
Our preliminary results indicate that Aklim has indeed good conditions for conducting astronomical observations and could be a site to host a future astronomical observatory, even of E-ELT dimensions. The Multi-Aperture Scintillation Sensors (MASS) is currently running at the Aklim site in combination with the DIMM aperture to determine the vertical profile of atmospheric turbulence. The results will be published in a forthcoming paper.
Acknowledgments
We are grateful to the Moroccan Hassan II Academy of Science and Technology, which financially supported the site testing campaigns at the Aklim site. This work is also supported by a collaboration with the European Union through the FP6 program. It is a real pleasure to thank Jean Vernin from Nice University, Marc Sarazin from ESO, Muñoz-Tuñón Casiana from IAC, and Andrei Tokovinin for collaboration, conversation, and advice. We provide here our sincere thanks. Our sincere gratitude also goes to the site surveyors and to all the staff members for their help and dedication. We used for this work the NCEP Reanalysis data provided by the NOAA/OAR/ESRL PSD, Boulder, Colorado, USA, from their Web site at http://www.esrl.noaa.gov/psd/. We would like to address our many thanks to the NCEP/NCAR staff. Finally, we wish to thank Cyril Cavadore, the developer of the seeingmonitor software, used here for the DIMM.
References
- Benkhaldoun, Z. 2002, in Astronomical Site Evaluation in the Visible and Radio Range, ed. J. Vernin, Z. Benkhaldoun, & C. Muñoz-Tuñón, ASP Conf. Ser., 266, 414 [Google Scholar]
- Benkhaldoun, Z., Kadiri, S., Lazrek, M., & Vernin, J. 1993, Exp. Astron., 2, 345 [Google Scholar]
- Benkhaldoun, Z., Abahamid, A., El Azhari, Y., & Lazrek, M. 2005, A&A, 441, 839 [NASA ADS] [CrossRef] [EDP Sciences] [Google Scholar]
- Bounhir, A., Benkhaldoun, Z., & Sarazin, M. 2008, in SPIE Conf. Ser., 7016 [Google Scholar]
- Ehgamberdiev, S. A., Baijumanov, A. K., Ilyasov, S. P., et al. 2000, A&AS, 145, 293 [Google Scholar]
- Erasmus, D. A., & van Rooyen, R. 2006, in SPIE Conf. Ser., 6267 [Google Scholar]
- Hill, F., Fischer, G., Forgach, S., et al. 1994, Sol. Phys., 152, 351 [NASA ADS] [CrossRef] [Google Scholar]
- Jabiri, A., Benkhaldoun, Z., Vernin, J., & Muñoz-Tuñón, C. 2000, A&AS, 147, 271 [Google Scholar]
- Kalnay, E., Kanamitsu, M., Kistler, R., et al. 1996, BAMS, 77, 437 [Google Scholar]
- Lombardi, G., Zitelli, V., Ortolani, S., & Pedani, M. 2006, PASP, 118, 1198 [NASA ADS] [CrossRef] [Google Scholar]
- Martin, H. M. 1987, PASP, 99, 1360 [NASA ADS] [CrossRef] [Google Scholar]
- Munoz-Tunon, C., Vernin, J., & Varela, A. M. 1997, A&AS, 125, 183 [Google Scholar]
- Murdin, P. 1985, Vistas Astron., 28, 449 [NASA ADS] [CrossRef] [Google Scholar]
- Sarazin, M., & Roddier, F. 1990, A&A, 227, 294 [NASA ADS] [Google Scholar]
- Sarazin, M. S., Graham, E., Beniston, M., & Riemer, M. 2003, in SPIE Conf. Ser., 4840, ed. J. R. P. Angel, & R. Gilmozzi, 291 [Google Scholar]
- Skidmore, W., Els, S., Travouillon, T., et al. 2009, PASP, 121, 1151 [NASA ADS] [CrossRef] [Google Scholar]
- Tokovinin, A. 2002, PASP, 114, 1156 [NASA ADS] [CrossRef] [Google Scholar]
- Ziad, A., Jabiri, A., Benkhaldoun, Z., et al. 2001, A&A, 365, 324 [Google Scholar]
All Tables
Daytime, night-time, and daily statistical results of the wind speed, temperature, and relative humidity for whole data set at Aklim site.
Monthly statistics of the seeing at Aklim site obtained from February 2007 to September 2008.
All Figures
|
Fig. 1 Wind vectors and wind velocity iso-values featured on the map from 18° W to 0° and from 22° N to 40° N, corresponding to Aklim’s altitude. The wind is averaged over an 11 year period, from 1997 to 2007. The star in the map is Aklim’s location. |
| In the text | |
|
Fig. 2 Cross-section of the Anti-Atlas plateau (east-west cut from long: 9.63W and lat: 30.41N to respectively 8.40W and 30.15N). The summit selected is the highest summit at the right of the figure and the Atlantic ocean is at the left. |
| In the text | |
|
Fig. 3 Monthly mean variation in the temperature measured at 2 m above the ground. The dash-dot, solid, and dashed lines represents, the daytime, night-time, and daily data respectively. Monthly mean variation in the temperature over 11 years (1998 − 2008) obtained form the NCEP/NCAR reanalysis in dotted line are represented to compare the two results. |
| In the text | |
|
Fig. 4 Monthly mean variation in relative humidity measured at ground level by the meteorological station. The dash-dot, solid, and dashed lines represents, respectively, the daytime, night-time, and daily data. Monthly mean variation in the relative humidity over 11 years (1998 − 2008) obtained from the NCEP/NCAR reanalysis are in dotted line. |
| In the text | |
|
Fig. 5 Monthly mean variation in wind speed measured at ground level by the meteorological station. The dash-dot, solid, and dashed lines represents, respectively, the daytime, night-time and daily data. Monthly mean variation of the wind speed over 11 years (1998 − 2008) obtained form the NCEP/NCAR reanalysis are in dotted line. |
| In the text | |
|
Fig. 6 Left side: wind rose measured at 2 m above ground level at Jbel Aklim. Right side: wind rose obtained from the NCEP/NCAR reanalysis data over the pixel containing Aklim site for eleven year average. |
| In the text | |
|
Fig. 7 Histogram and cumulative frequency of all seeing data at Aklim site. Global statistics of 105 observing nights from February 2007 to September 2008. |
| In the text | |
Current usage metrics show cumulative count of Article Views (full-text article views including HTML views, PDF and ePub downloads, according to the available data) and Abstracts Views on Vision4Press platform.
Data correspond to usage on the plateform after 2015. The current usage metrics is available 48-96 hours after online publication and is updated daily on week days.
Initial download of the metrics may take a while.