Fig. 3
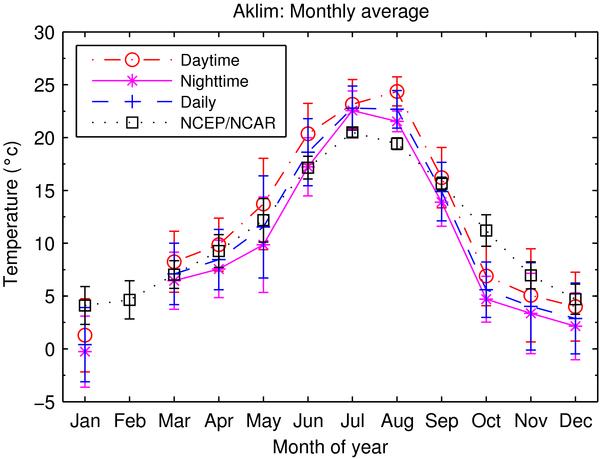
Monthly mean variation in the temperature measured at 2 m above the ground. The dash-dot, solid, and dashed lines represents, the daytime, night-time, and daily data respectively. Monthly mean variation in the temperature over 11 years (1998 − 2008) obtained form the NCEP/NCAR reanalysis in dotted line are represented to compare the two results.
Current usage metrics show cumulative count of Article Views (full-text article views including HTML views, PDF and ePub downloads, according to the available data) and Abstracts Views on Vision4Press platform.
Data correspond to usage on the plateform after 2015. The current usage metrics is available 48-96 hours after online publication and is updated daily on week days.
Initial download of the metrics may take a while.