Fig. 9
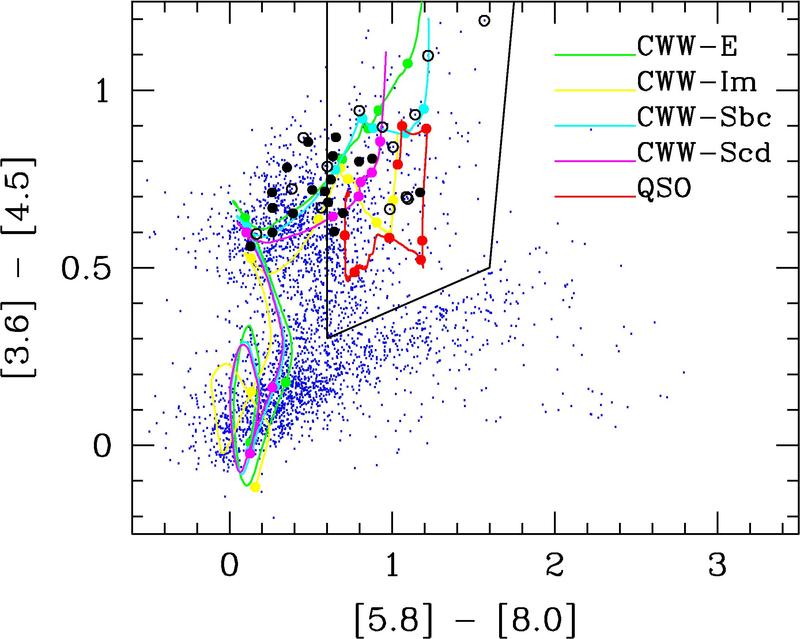
Infrared colours of the sources listed in Table 1. HST-detected sources are plotted in filled circles and HST non-detections in open circles. All 3.6 μm detected sources are plotted in blue dots. The colour lines track the colours of the Coleman et al. (1980) SED templates with redshift and the black lines mark the region where infrared-selected AGN are located (Stern et al. 2005). (This figure is available in color in electronic form.)
Current usage metrics show cumulative count of Article Views (full-text article views including HTML views, PDF and ePub downloads, according to the available data) and Abstracts Views on Vision4Press platform.
Data correspond to usage on the plateform after 2015. The current usage metrics is available 48-96 hours after online publication and is updated daily on week days.
Initial download of the metrics may take a while.