Fig. 7
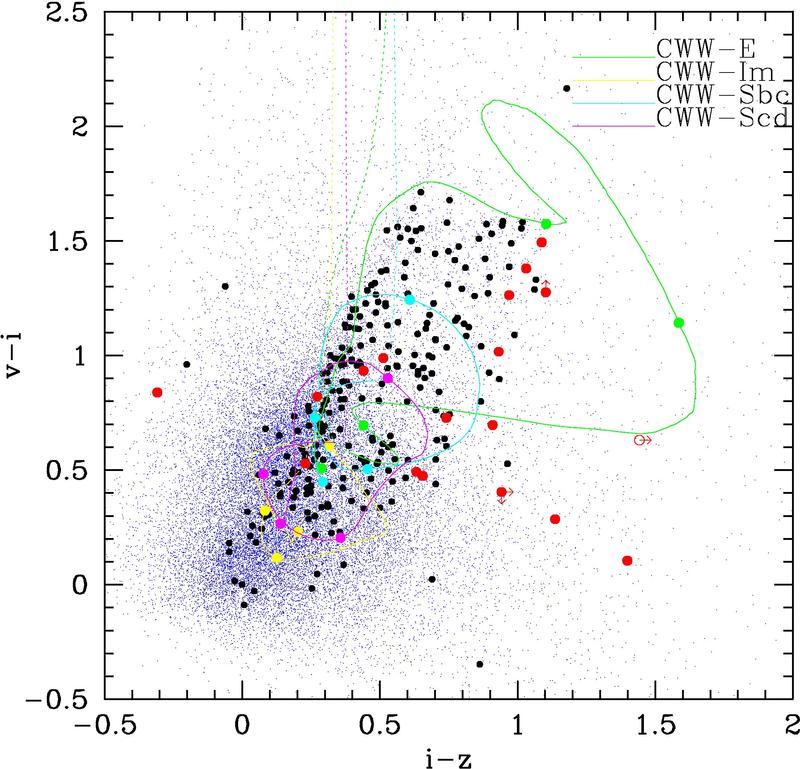
Optical colours of HST-detected sources. The optically faint sources of Table 1 appear in red and the X-ray sources appear in black. For comparison, all HST sources of Giavalisco et al. (2004) are plotted in blue. Colour lines track the colours of the Coleman et al. (1980) SED templates with redshift. (This figure is available in color in electronic form.)
Current usage metrics show cumulative count of Article Views (full-text article views including HTML views, PDF and ePub downloads, according to the available data) and Abstracts Views on Vision4Press platform.
Data correspond to usage on the plateform after 2015. The current usage metrics is available 48-96 hours after online publication and is updated daily on week days.
Initial download of the metrics may take a while.