Fig. 10
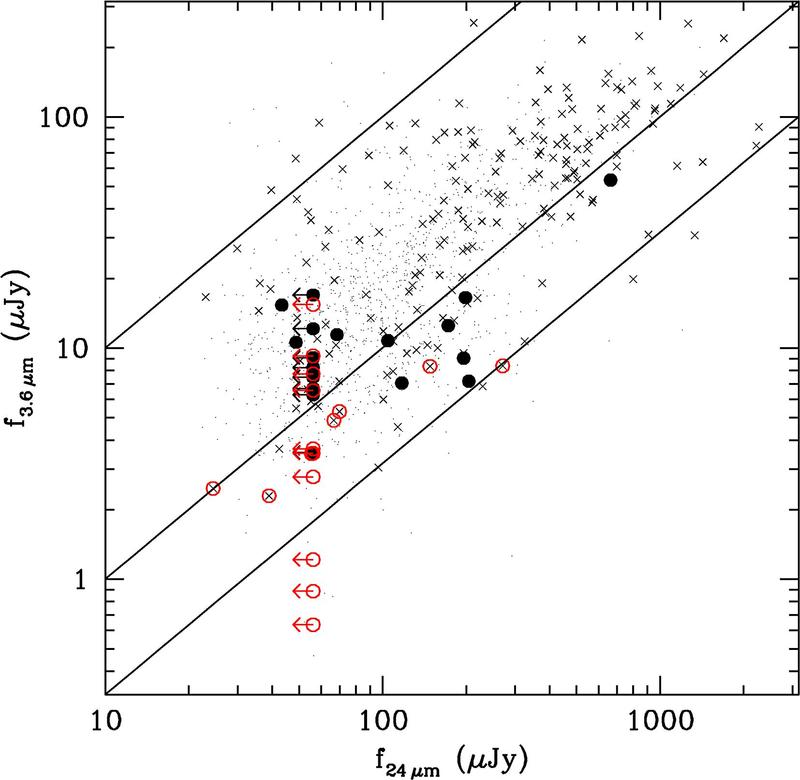
3.6 μmvs. 24 μm emission. Dots represent the overall 3.6 μm population with a 24μm counterpart, crosses the counterparts of X-ray sources, black filled circles the sources of Table 1 detected with the HST and red open circles the sources of Table 1 not detected with the HST. The lines mark log (f3.6μm/f24μm) = 0, − 1, − 1.5. (This figure is available in color in electronic form.)
Current usage metrics show cumulative count of Article Views (full-text article views including HTML views, PDF and ePub downloads, according to the available data) and Abstracts Views on Vision4Press platform.
Data correspond to usage on the plateform after 2015. The current usage metrics is available 48-96 hours after online publication and is updated daily on week days.
Initial download of the metrics may take a while.