Fig. 6
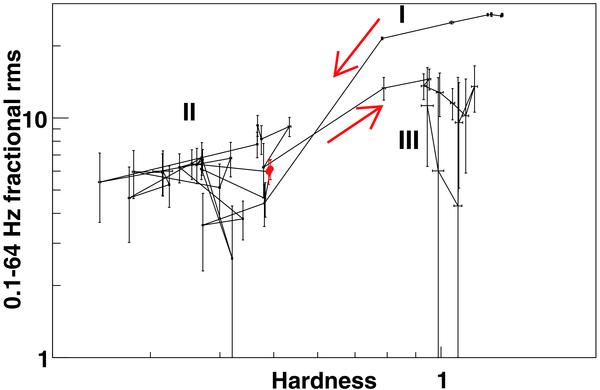
The hardness-rms diagrams (HRDs) of outburst #6. The arrows show the evolution in time, and the three regions denote the LHS/HIMS (region I), the HSS (region II) and the LHS/HIMS (region III) during the decay of the outburst. The two red points (almost on top of each other) most likely correspond to a short SIMS. Each data point is derived from one OBSID.
Current usage metrics show cumulative count of Article Views (full-text article views including HTML views, PDF and ePub downloads, according to the available data) and Abstracts Views on Vision4Press platform.
Data correspond to usage on the plateform after 2015. The current usage metrics is available 48-96 hours after online publication and is updated daily on week days.
Initial download of the metrics may take a while.