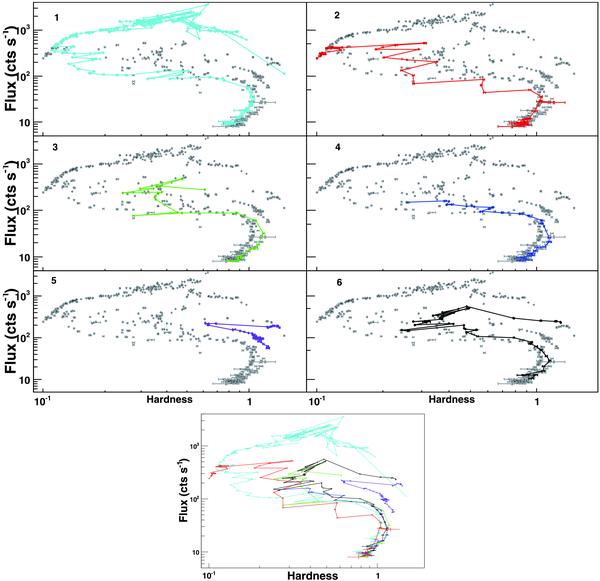
Fig. 2

The hardness-intensity diagrams (HIDs) of the six outbursts observed by RXTE/PCA. The hardness is defined as the ratio of count rates in the 6–19 keV band to the 3–6 keV band, as extracted from the lightcurves. The intensity is in units of count rates in the 3–21 keV band. The gray points represent all of the six outbursts together, each outburst being plotted in colour against this gray background. For comparison, we mosaic the six HIDs in the bottom panel. The time bin-size for each data point is 6400 s. Note that the HIDs were reported in Dunn et al. (2010) for the outbursts #1–5 and in Capitanio et al. (2009) for outbursts #4–5.
Current usage metrics show cumulative count of Article Views (full-text article views including HTML views, PDF and ePub downloads, according to the available data) and Abstracts Views on Vision4Press platform.
Data correspond to usage on the plateform after 2015. The current usage metrics is available 48-96 hours after online publication and is updated daily on week days.
Initial download of the metrics may take a while.


