Free Access
Fig. 4
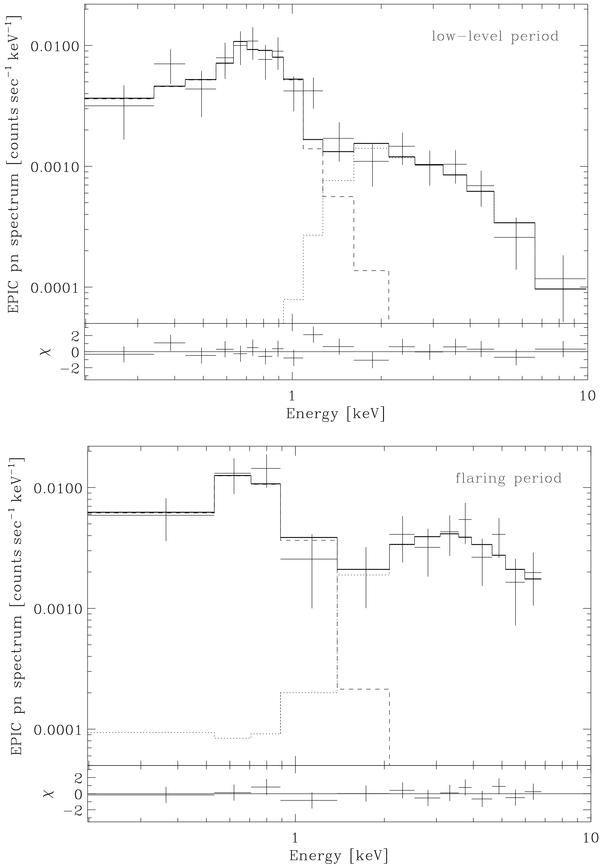
pn spectra of EX Lup. Top panel: low-level emission. Bottom panel: flaring emission. The continuous, dashed and dotted lines are the best model of the whole spectrum, and the soft and hard components (see Table 1), respectively. The residuals of the fit (in sigma units) are shown in the bottom sections of each panel.
This figure is made of several images, please see below:
Current usage metrics show cumulative count of Article Views (full-text article views including HTML views, PDF and ePub downloads, according to the available data) and Abstracts Views on Vision4Press platform.
Data correspond to usage on the plateform after 2015. The current usage metrics is available 48-96 hours after online publication and is updated daily on week days.
Initial download of the metrics may take a while.