| Issue |
A&A
Volume 522, November 2010
|
|
|---|---|---|
| Article Number | A19 | |
| Number of page(s) | 9 | |
| Section | Interstellar and circumstellar matter | |
| DOI | https://doi.org/10.1051/0004-6361/200913766 | |
| Published online | 27 October 2010 | |
Ground-state ammonia and water in absorption towards Sgr B2
1
Onsala Space Observatory, Chalmers University of Technology,
43992
Onsala
Sweden
e-mail: per.bergman@chalmers.se
2
European Southern Observatory, Alonso de Cordova 3107, Vitacura, Casilla
19001, Santiago, Chile
3
Stockholm Observatory, AlbaNova, 10691
Stockholm,
Sweden
4
GEPI, Observatoire de Paris, CNRS, 5 place Jules Janssen, 92195
Meudon,
France
5
LERMA & UMR 8112 du CNRS, Observatoire de Paris, 61
Av. de l’Observatoire, 75014
Paris,
France
6
LERMA & UMR 8112 du CNRS, École Normale Supérieure, 24 rue Lhomond,
75005
Paris,
France
7
Swedish Space Corporation, PO Box 4207,
17104
Solna,
Sweden
Received:
28
November
2009
Accepted:
7
June
2010
Context. Observations of transitions to the ground-state of a molecule are essential to obtain a complete picture of its excitation and chemistry in the interstellar medium, especially in diffuse and/or cold environments. For the important interstellar molecules H2O and NH3, these ground-state transitions are heavily absorbed by the terrestrial atmosphere, hence not observable from the ground.
Aims. We attempt to understand the chemistry of nitrogen, oxygen, and their important molecular forms, NH3 and H2O in the interstellar medium of the Galaxy.
Methods. We have used the Odin* submillimetre-wave satellite telescope to observe the ground state transitions of ortho-ammonia and ortho-water, including their 15N, 18O, and 17O isotopologues, towards Sgr B2. The extensive simultaneous velocity coverage of the observations, > 500 km s-1, ensures that we can probe the conditions of both the warm, dense gas of the molecular cloud Sgr B2 near the Galactic centre, and the more diffuse gas in the Galactic disk clouds along the line-of-sight.
Results. We present ground-state NH3 absorption in seven
distinct velocity features along the line-of-sight towards Sgr B2. We find a nearly linear
correlation between the column densities of NH3 and CS, and a square-root
relation to N2H+. The ammonia abundance in these diffuse Galactic
disk clouds is estimated to be about 0.5–1 × 10⁻⁸, similar to that observed for
diffuse clouds in the outer Galaxy. On the basis of the detection of
 absorption in the 3 kpc arm, and the absence
of such a feature in the
absorption in the 3 kpc arm, and the absence
of such a feature in the
 spectrum, we conclude that the water
abundance is around 10-7, compared to ~10-8 for NH3.
The Sgr B2 molecular cloud itself is seen in absorption in NH3,
15NH3, H2O,
, and
, with emission superimposed on the absorption in
the main isotopologues. The non-LTE excitation of NH3 in the environment of
Sgr B2 can be explained without invoking an unusually hot (500 K) molecular layer. A hot
layer is similarly not required to explain the line profiles of the
11,0 ← 10,1 transition from
H2O and its isotopologues. The relatively weak 15NH3
absorption in the Sgr B2 molecular cloud indicates a high [14N/15N]
isotopic ratio > 600. The abundance ratio of
and is found to be relatively low, 2.5–3. These
results together indicate that the dominant nucleosynthesis process in the Galactic centre
is CNO hydrogen burning.
spectrum, we conclude that the water
abundance is around 10-7, compared to ~10-8 for NH3.
The Sgr B2 molecular cloud itself is seen in absorption in NH3,
15NH3, H2O,
, and
, with emission superimposed on the absorption in
the main isotopologues. The non-LTE excitation of NH3 in the environment of
Sgr B2 can be explained without invoking an unusually hot (500 K) molecular layer. A hot
layer is similarly not required to explain the line profiles of the
11,0 ← 10,1 transition from
H2O and its isotopologues. The relatively weak 15NH3
absorption in the Sgr B2 molecular cloud indicates a high [14N/15N]
isotopic ratio > 600. The abundance ratio of
and is found to be relatively low, 2.5–3. These
results together indicate that the dominant nucleosynthesis process in the Galactic centre
is CNO hydrogen burning.
Key words: astrochemistry / ISM: molecules / ISM: abundances / submillimeter: general / Galaxy: disk
Odin is a Swedish-led satellite project funded jointly by the Swedish National Space Board (SNSB), the Canadian Space Agency (CSA), the National Technology Agency of Finland (Tekes), and the centre National d'Études Spatiales (CNES, France). The Swedish Space Corporation (SSC) was the industrial prime contractor and is also responsible for the satellite operation.
© ESO, 2010
1. Introduction
Less than 100 pc from the dynamical centre of the Galaxy lies its most massive molecular cloud complex, Sgr B2. Embedded in the gas along a north-south line are three radio continuum peaks called north (N), middle/main (M) and south (S). These peaks are separated from each other by approximately 50″, which corresponds to projected linear separations of 1.9 pc at a distance of 8 kpc. Sgr B2(S) is the weakest of the three and (N) is the most intense source at longer wavelengths, λ ≥ 800 μm. Sgr B2(M) dominates at shorter wavelengths. The molecular lines of Sgr B2 are seen in both emission and absorption against the continuum sources (e.g., Nummelin et al. 2000; Polehampton et al. 2007). The hot core of Sgr B2(N) displays an extreme chemical richness exhibiting strong emission lines of many complex carbon-bearing molecules. In addition, line-of-sight clouds associated with molecular gas concentrations in the Galactic plane produce absorption lines towards Sgr B2 in several atomic and molecular species, e.g. H i (Garwood & Dickey 1989), O i and C ii (Vastel et al. 2002), H2CO (Zuckerman et al. 1970; Whiteoak & Gardner 1979; Wadiak et al. 1988), CS (Greaves & Williams 1994), H2O (Neufeld et al. 2003), CH (Whiteoak et al. 1985; Polehampton et al. 2005b), and OH (Robinson & McGee 1970; Polehampton et al. 2005a).
We present observations of ground state ortho-ammonia and ortho-water, including their 15N, 18O, and 17O isotopologues, towards Sgr B2. The submm-wave spectra cover more than 500 km s-1 in Doppler velocity and thus trace absorption in both the Sgr B2 molecular cloud complex and several line-of-sight Galactic clouds.
2. Observations and data reduction
The submillimetre wave spectroscopy satellite Odin has observed absorption in the
ground-state rotational line (J,K) = (1, 0) ← (0, 0) of NH3 at
572.498 GHz as well as the ground-state rotational transition
JK − ,K + = 11,0 ← 10,1
of H2O at 556.936 GHz,
at 547.676 GHz, and
at 552.021 GHz towards Sgr B2. The satellite was
pointed within 3″ of α = 17h47m19ṣ7,
δ = −28° 22′ 51″̣4 (J2000), which corresponds to a position between
Sgr B2(M) and (N) and encompasses both these cores within the projected beam of 2′, full
width at half-maximum (FWHM). The pointing uncertainty was ≤ 15″, not
large enough to affect the signal strengths significantly.
The NH3 and
observations were carried out during August
(NH3: 30 orbits, 10 h on-source) and September (: 60 orbits, 18 h on-source) 2003, while the
H2O observations comprised of 23 orbits (7 h on-source) during February 2005.
All these data were acquired in position-switching mode (PSW) where the spacecraft was
reoriented to an off-position at (−1800″, +1750″), in cycles of two minutes, to measure
signal-free reference spectra.
The observations were carried out in two separate
campaigns: during September 2003 (60 orbits, 16 h on-source) and October 2006 (100 orbits,
28 h on-source). The 2003 data were acquired in sky-switching mode, meaning that pairs of
on-source/off-source spectra were measured in cycles of 20 s by means of side-looking,
large-beam sky mirrors and a chopper wheel. In 2006, PSW was employed as described above.
In all observations, the chopper wheel method was used for calibration (Frisk et al. 2003; Olberg et al. 2003). The resulting system temperatures were typically 3200–3700 K near the tuning centres, but sometimes varied significantly across the band, being up to a factor of two higher in short segments in peripheral parts of the passband. The data were recorded with an acousto-optical spectrometer (AOS) giving a ~0.3 km s-1 velocity resolution over > 540 km s-1 bandwidth at all four frequency settings. In the case of the PSW data, the effective velocity resolution is somewhat lower (~0.4 km s-1) due to the uncompensated change of satellite line-of-sight velocity during the on-integrations.
An additional 25 orbits of data were recorded using another spectrometer
in 2002 and – while not included here due to stability issues – show good general agreement
with the data acquired later.
3. Results
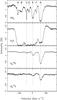 |
Fig. 1 Part of the Odin spectra towards Sgr B2. The absorption features marked A–G are identified in Table 1. The radial velocity is indicated with respect to the local standard of rest and to the rest frequencies listed in Sect. 2. |
Figure 1 presents the central parts of the resulting
spectra from the four observed frequency bands in terms of main beam brightness temperature
(Tmb) as a function of velocity in the local standard of rest
frame (VLSR). The continuum level for H2O was
determined by assuming complete absorption over the intervals −100 to −80 and −45 to
+20 km s-1, giving a continuum temperature of
TC = 1.29 K. This continuum level was then also adopted for
NH3, , and , since the frequencies are similar and the
continuum levels are typically not well calibrated in position-switched data. However, a
continuum temperature determined in this way sets a definite lower limit to the true value
in our beam. It is consistent with what we derive by interpolating between the Sgr B2 (M)
dust continuum observations at 450 and 800 μm by Goldsmith et al. (1990), and similar to the continuum temperature of
1.2 K measured by SWAS at the same frequency (Neufeld et al. 2003). Because the SWAS beam was even
larger (3′̣3 × 4′̣5) than the Odin beam, we confirm that the dust emission is very extended
at these frequencies, filling the Odin beam.
The NH3 spectrum in Fig. 1 shows at least seven distinct absorption features at velocities lower than +60 km s-1, the approximate velocity of the Sgr B2 molecular cloud itself. The background continuum source being at Sgr B2, all these velocity components can be assigned to rather well-known molecular gas concentrations along our line-of-sight towards Sgr B2. Table 1 lists the absorption features and their origins in order of increasing Galactic radius R.
Absorption feature identifications in order of increasing Galactic radius.
To determine Galactocentric distances, an appropriate model of the Galactic gas kinematics has to be applied. The most common approach among observers has been to assume simply that the gas moves in circular orbits in the form of a disk and/or several rings, possibly with an additional expansion velocity to account for the 3 kpc arm feature (feature C, e.g., Whiteoak & Gardner 1979). More detailed modelling of the large-scale Galactic gas dynamics, using a barred potential, reproduces existing H i and CO position-velocity data (Englmaier & Gerhard 1999; Bissantz et al. 2003), but the model resolution is insufficiently high to make accurate predictions about the central 1 kpc of the Galaxy. However, the model does support the idea that the high-velocity gas (|V| > 80 km s-1) along the line-of-sight towards the Galactic centre is confined to this central region.
The determination of Galactocentric distance of course also depends on the adopted
Galactocentric radius of the Sun, R0. Over the years, this
parameter has been assigned values between 7 and 10 kpc, and in 1985 the IAU recommended the
use of R0 = 8.5 kpc. More indirect measurements using open star
clusters (Bobylev et al. 2007) and bulge red clump
stars (Nishiyama et al. 2006), as well as direct
geometric measurements of a star as close as 0″̣1 to the Galactic central massive black hole
(Eisenhauer et al. 2005), all yield estimates
within 0.3 kpc of R0 = 7.6 kpc. Thus, this value has been used
to linearly scale the distances of the references given in Table 1. This also agrees well with a measurement of the astrometric parallax of
water masers in Sgr B2, which implies that  kpc (Reid et al. 2009).
Based on both the velocity and line-shape, feature E in the NH3 spectrum corresponds to the one observed around 0 km s-1 in ammonia inversion transitions up to (6, 6) by Gardner et al. (1988). These authors argue that the high temperatures needed to excite these states, together with the broad (> 15 km s-1) and asymmetric line-shape, imply that the gas must be associated with Sgr B2 itself, possibly in the form of ejecta in the direction towards the Sun. On the other hand, absorption is also observed around 0 km s-1, with line-widths of ≲ 10 km s-1, in H i (Garwood & Dickey 1989) and H2CO (Mehringer et al. 1995), and is then associated instead with cold foreground gas in the “local” ISM (the Orion/Sagittarius Galactic spiral arms). Furthermore, absorption at the same velocity is also seen in the ground-state ammonia transition in the direction of Sgr A (Sandqvist et al., in prep.), which would of course be highly unlikely if all of the absorption that we observe arises in the Sgr B2 region.
Unfortunately, the water absorptions at feature E do not contribute to an
unambiguous identification of its source. Both and exhibit absorption in feature E with
the same broad line-shape as that in ammonia (Fig. 1),
implying that the absorptions have a common origin of a steep decline at lower velocities
and then a slow rise over about 20 km s-1. On the one hand, the high
signal-to-noise ratio absorption in is optically thin, but nevertheless very smooth
without any overlapping narrow components that would be expected from local gas. On the
other hand, H2O maps of the Sgr B2 region (Neufeld et al. 2003) show that the absorption around 0 km s-1 is far
more extended than that of Sgr B2 itself (corresponding to feature G), again
arguing for an origin in the Galactic disk. As a consequence, we consider feature E
to be a superposition of unknown proportions of absorption from a Sgr B2 ejecta and
one or several more local gas concentrations, within a few kpc of the Sun.
Feature F has previously often been assigned to the “Scutum arm”, about halfway between the Sun and the Galactic centre (e.g. Greaves & Williams 1994), but in the context of Galactic rotation models (Bissantz et al. 2003) this seems highly unlikely. It would mean that the Scutum arm is falling in towards the Galactic centre, while the motion of the well-studied 3 kpc arm is in the opposite direction. Moreover, feature F has a counterpart in H2CO position-velocity diagrams of the Galactic centre, which appears to be localised around Sgr B2 in Galactic longitude (Whiteoak & Gardner 1979). This is confirmed by the absence of formaldehyde absorption at the corresponding velocity (~ +23 km s-1) towards Sgr A in the study by Sandqvist (1970), but on the other hand they do report an H i absorption at this velocity. Because of the ambiguity of the available data, we refrain from specifying the location of the ammonia gas absorbing at feature F.
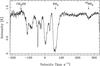 |
Fig. 2 The full observed band covering the NH3 absorptions towards Sgr B2. In addition to 14NH3, the ground state 15NH3 line, seen in absorption, and the 151,15–140,14 CH3OH transition, seen in emission, are marked at VLSR = +65 km s-1, respectively. |
The > 1 GHz wide observed band around the NH3 572.498 GHz line includes the corresponding ground-state 15NH3 absorption at 572.112 GHz from the Sgr B2 cloud itself, as well as emission in the CH3OH 151,15 → 140,14 transition from that same cloud (see Fig. 2). We note that even the most narrow NH3 absorption features (D with ΔV ≥ 4 km s-1) are too broad for the hyperfine quadrupole components to be resolved (F = 1–2, the main central component; F = 1–1, shifted by −0.6 km s-1; F,= 1–0, shifted by +1 km s-1). A straightforward line profile model also indicates that the slight asymmetry caused by the hyperfine structure of absorption lines of these intensities will be too small to distinguish – even if the intrinsic line-widths are as small as 1 km s-1.
The H2O spectrum shows ground-state water absorption in the range −120 to +100 km s-1, superimposed on ground-state water emission from the Sgr B2 cloud itself around +60 km s-1(~20 to 120 km s-1). The region around Sgr B2 was mapped in this frequency range by SWAS (Neufeld et al. 2003), which found that both the absorbing and emitting water vapour is extended relative to the Odin beam. However, the absorption lines are saturated across almost the whole velocity range, preventing a detailed analysis of the profile.
Both
and
contain absorption from the Sgr B2 cloud itself,
G, and feature E as discussed above. In addition, there is a
clear
absorption corresponding to the narrow feature
C of ammonia (the 3 kpc arm).
4. The line-of-sight clouds
4.1. Ammonia
As noted above, the ground-state ammonia absorption in the velocity range
−120 km s-1 to 40 km s-1 can all be identified with certain
molecular gas concentrations in the Galactic spiral arms and bar(s), except the mixed
feature E at V ≈ 0 km s-1 as discussed in
Sect. 3. Of these, only feature C has
been observed in any of the higher excited states of ammonia (the (1, 1) and (2, 2)
inversion lines, Hüttemeister et al. 1993). That
absorption and no emission is seen against a continuum background of only 1.3 K ensures
that the excitation temperature in this gas is close to
TCMB = 2.725 K, the temperature of the cosmic microwave
background radiation, and that essentially all ammonia molecules reside in their ground
state. The column density of o-NH3 in each component, assuming this component
to be homogeneous, can then be directly obtained from the integrated optical depth of each
feature  (1)where the column
density is given in units of cm-2. Since
Tex ≃ TCMB for the
(1, 0) ← (0, 0) transition, the optical depth (τ) of each feature is
also simply given by the line-to-continuum ratio,
τ = −ln(1 − I / Icont).
In cases where we compared “features” and not simply integrated intensities in velocity
bins, we assumed that the optical depth has a Gaussian distribution across the feature
(1)where the column
density is given in units of cm-2. Since
Tex ≃ TCMB for the
(1, 0) ← (0, 0) transition, the optical depth (τ) of each feature is
also simply given by the line-to-continuum ratio,
τ = −ln(1 − I / Icont).
In cases where we compared “features” and not simply integrated intensities in velocity
bins, we assumed that the optical depth has a Gaussian distribution across the feature
 (2)where the maximum optical
depth, τc, the line velocity, Vc,
and the Gaussian full width at half maximum,
ΔVFWHM, were fitted to the data in a least
squares sense.
(2)where the maximum optical
depth, τc, the line velocity, Vc,
and the Gaussian full width at half maximum,
ΔVFWHM, were fitted to the data in a least
squares sense.
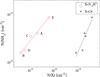 |
Fig. 3 Column density relation between our observed o-NH3 and N2H+ and CS respectively. The column densities are calculated from optical depths integrated over five velocity bins associated with absorption features as indicated by capital letters in the plot. N2H+ and CS data as well as ranges of velocity bins are adopted from Greaves & Nyman (1996). The solid lines show the logarithmic least-square fits to each of the data sets, and their slopes are 1.15 ± 0.27 and 0.63 ± 0.07 for CS and N2H+, respectively. |
We compared the o-NH3 absorption to observations of other molecules in these “spiral arm” clouds. For example, Greaves & Nyman (1996) observed 11 different molecules towards Sgr B2(M) and performed a coherent analysis over six distinct velocity ranges below +22 km s-1. One of these velocity bins (around − 60 km s-1) was found to contain mainly absorption in the carbon chain molecules and not to have a counterpart in NH3. It was therefore excluded from our analysis. The velocity bins used are indicated by blue dashed boxes in Fig. 4. We also note that the beam-size of the Greaves & Nyman (1996) observations is smaller than half of that in the Odin observations (FWHM of 50″ compared to 2′ for Odin). Comparing our o-NH3 column densities (lower limits from Eq. (1)) in these velocity “bins” to their resulting column densities, we find striking correlations with respect to two of the molecules, CS and N2H+. Figure 3 shows the logarithmic least square fits to the data, demonstrating that there is a close to linear correlation between o-NH3 and CS, while the relation to N2H+ follows instead a square-root law. A square-root relation such as this is what would be expected if the increase in column density of both molecules is simply governed by the statistical availability of nitrogen atoms. The correlation between NH3 and CS is close to linear and implies an abundance ratio of [CS/NH3] ≈ 3, comparable to the abundance ratio of about 1 reported for diffuse molecular clouds outside the Galactic plane by Liszt et al. (2006). The similar correlation between CS and NH3 implies that the chemistry in these clouds and absorbing spiral arm clouds is not too different.
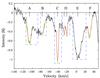 |
Fig. 4 Gaussian optical depth fits to the observed ground-state NH3 absorptions, corresponding to components in formaldehyde. The spectrum in black is the continuum-subtracted (TC = 1.29 K) observed spectrum. The velocity ranges over which the fits are made are highlighted in green and the fits themselves are shown in red. The blue dashed boxes mark the velocity ranges over which the absorption is integrated for the column density comparisons in Fig. 3. |
CS was also observed towards Sgr B2(N) and (M) separately at a higher velocity resolution (0.2 km s-1) by Greaves & Williams (1994). Within the more narrow velocity range covered by these observations, the large-scale absorption structure is similar to NH3, but the number of absorption components is higher in CS. Our interpretation is that within our much larger beam, both encompassing (N) and (M), there are probably several absorbing clouds at each Galactocentric distance indicated in Table 1, partly overlapping in velocities, in some cases covering both continuum sources and in some cases not.
Early observations of ortho-formaldehyde (o-H2CO) towards a number of Galactic radio continuum sources, including Sgr B2 (Downes et al. 1980; Wadiak et al. 1988) have approximately the same spatial and spectral (velocity) resolution as the Odin observations (beam FWHM 2′̣1 and velocity resolution ~0.2 km s-1 in Wadiak et al. 1988). Since formaldehyde can be used as an H2 column density tracer, with a typical abundance of (2−4) × 10-9 in Galactic clouds observed in absorption (Dickel & Goss 1990; Dickel et al. 1997; Liszt et al. 2006), we use these data to estimate the o-NH3 abundance in the line-of-sight clouds. Table 2 presents the central optical depths and velocity widths (FWHM) of the Gaussian optical depth fits to o-NH3 absorption components, the resulting column densities, the corresponding centre velocities and column densities of formaldehyde, and the resulting o-NH3 abundances. We note that the fitted components do not account for all the line-of-sight ammonia absorption lines (see Fig. 4), only those that have counterparts in formaldehyde. The reported formaldehyde absorption at −45.9 km s-1 does not have a clear counterpart in ammonia.
Results of optical depth fits and resulting o-NH3 abundances derived from H2CO observations by Wadiak et al. (1988) and CH observations by Polehampton et al. (2005b).
The rather close correlation between the NH3 and H2CO column densities, apparent from Table 2, implies an o-NH3 abundance of 1–3 × 10⁻⁹ in the line-of-sight clouds, if the H2CO abundance is 2 × 10⁻⁹. Assuming an ortho/para ratio (OPR) of unity, the NH3 abundances inferred from Table 2 (X(NH3) = 3.8 × 10⁻⁹ on average) are similar to those reported for diffuse clouds, X(NH3) = 2 × 10⁻⁹ by Liszt et al. (2006).
For comparison, we also used the ground-state transition of CH, observed by ISO (Polehampton et al. 2005a), to estimate the H2 column density and the o-NH3 abundance in the line-of-sight clouds. The spectral resolution of the ISO LWS is only 30–40 km s-1, but the central velocities and velocity widths of the absorption lines were directly adopted from the H i absorption data of Garwood & Dickey (1989) and then fitted to the data, giving estimated errors in the CH column of typically 50%. We adopted a CH abundance of [CH]/[H2] = 4 × 10⁻⁸, which yields overall slightly higher o-NH3 abundances (i.e., smaller H2 column densities) than when using H2CO as H2 tracer (see Table 2). The average abundance for the line-of-sight clouds is then X(NH3) = 1.2 × 10⁻⁸, assuming an ammonia OPR of unity.
From these two different tracers of H2 column density, one mostly giving lower abundance limits and the other having rather large errorbars, we inferred that in general the ammonia abundance in the diffuse clouds of the Galactic disk is of the order of 0.5–1 × 10⁻⁸, in reasonable and unexpected agreement with the abundances observed for diffuse clouds in the outer Galaxy (Liszt et al. 2006).
The (1, 1) and (2, 2) inversion lines of p-NH3 were observed in absorption towards Sgr B2 (M) at −40 km s-1, corresponding to feature C and associated with the 3 kpc arm, by Hüttemeister et al. (1993). A rotation temperature of 16 K was derived for these two levels and the total column density in the two metastable states (~1 × 1014 cm-2, Tex ≃ 3 K) is significantly higher than what we find for o-NH3, ~3 × 1013 cm-2 (Table 2). Even taking into account the population in the three lowest o-NH3 levels at an excitation temperature of 16 K, the column density only reaches ~5 × 1013 cm-2, still half of that found for p-NH3. Since the velocity range of the spectra presented in Hüttemeister et al. (1993) does not cover the reported absorption at −40 km s-1, we were unable to estimate the possible errors in their column density determinaton, but an OPR of less than unity is not easily explained. The ammonia abundances that we derived for feature C, using the excitation temperature of 16 K and an OPR of unity, are 6 × 10⁻⁹ (using N(H2) = 1.7 × 1022 cm-2 from H2CO) or 3 × 10⁻⁸ (using N(H2) = 3.8 × 1021 cm-2 from CH).
4.2. Non-LTE excitation of ammonia
Our measurement of the ammonia abundance was based on assumptions that have become standard in the astrophysical literature: that the rotational excitation temperature relating the intensities of different inversion transitions is closely coupled to the kinetic temperature, while the excitation temperature relating the populations of the (1, 0) and (0, 0) levels approaches TCMB = 2.725 K at low densities in absorbing clouds (Walmsley & Ungerechts 1983; Danby et al. 1988). The total abundance ratio of ortho to para modifications cannot be readily determined but is presumed to “reflect conditions at an earlier time” (Ho & Townes 1983), which implies that it is related to the formation process. An accurate accounting of the populations of many states of NH3 is needed in order to compare observations of a single rotational line of the ortho form with one or more lines of the para form. This accounting is greatly complicated by the existence of metastable states, which are responsible for some of the most readily observed absorption lines. We discuss briefly how we used detailed models of non-LTE excitation of NH3 to test the common assumptions and refine the analysis of our observations.
We used an enhanced version of the RADEX code (van der Tak et al. 2007) to describe the level populations and line intensities of NH3 molecules. The molecular data included not only the rotational and inversion transitions, but also vibrational transitions. The energies, transition frequencies, and transition probabilities were taken from the ab initio calculations of Yurchenko et al. (2009). In the current model, 847 states and 7803 radiative transitions were considered. The inelastic collision rates of Danby et al. (1988) were adopted for collisions of H2(J = 0) with NH3 in its lowest states. In addition, we adopted estimates of collision rates involving more highly excited states: without these estimated collision rates, we would have found a large number of metastable and long-lived excited states with artifically high populations. The ortho and para states were considered together and their relative populations were controlled by a parameter, the formation temperature Tform, such that the chemical source rate of each rotational state (J,K) was
 where
EJ,K is the energy of the state and
gns is the nuclear-spin statistical weight (2 for para and 4
for ortho states). For the chemical rates of formation and destruction expected in the
interstellar medium, there is probably no competitive interchange process (Cheung et al. 1969). Consequently, the overall
ortho/para ratio is controlled by the adopted value of Tform.
For the model molecule discussed here, ortho/para ~1 in the limit of high
Tform. That is, the ortho and para states contribute
comparably to the partition function even though each ortho rotation-inversion level has
higher statistical weight because there are nearly twice as many low-lying para levels up
to the same energy. More importantly, in our formulation the formation process can be an
important source of highly excited metastable states, especially in conditions of diffuse
clouds. Far-infrared continuum radiation also plays an important role, even in diffuse
molecular gas because the average Galactic background radiation has a significantly higher
brightness temperature than the CMB and thus excites metastable states to higher
rotational levels more quickly than thermalizing collisions.
where
EJ,K is the energy of the state and
gns is the nuclear-spin statistical weight (2 for para and 4
for ortho states). For the chemical rates of formation and destruction expected in the
interstellar medium, there is probably no competitive interchange process (Cheung et al. 1969). Consequently, the overall
ortho/para ratio is controlled by the adopted value of Tform.
For the model molecule discussed here, ortho/para ~1 in the limit of high
Tform. That is, the ortho and para states contribute
comparably to the partition function even though each ortho rotation-inversion level has
higher statistical weight because there are nearly twice as many low-lying para levels up
to the same energy. More importantly, in our formulation the formation process can be an
important source of highly excited metastable states, especially in conditions of diffuse
clouds. Far-infrared continuum radiation also plays an important role, even in diffuse
molecular gas because the average Galactic background radiation has a significantly higher
brightness temperature than the CMB and thus excites metastable states to higher
rotational levels more quickly than thermalizing collisions.
For a representative model of a diffuse molecular cloud at kinetic temperature Tk = 30 K and density of para-hydrogen 102.5 cm-3, we derived the following when the formation temperature is Tform = 1000 K (formation by endoergic gas-phase processes). The excitation temperatures of the (1, 1) and (2, 2) inversion transitions were found to be 2.9 K, and those of the (3, 3) inversion transition, 3.1 K, while those of the inversion transitions involving higher metastable states were close to TCMB = 2.725 K. The excitation temperature of the (1, 0)–(0, 0) transition at 572 GHz was found to be 2.815 K, and its optical depth
 where N
is the total column density of NH3 in cm-2 and ΔV
is the full-width at half-maximum of the line profile in km s-1. The assumption
of an excitation temperature close to the temperature of the CMB is thus a good one. In
the fifth column of Table 2, the total ammonia
column densities calculated from this expression are presented for the observed
line-of-sight features. These column densities are all only slightly larger than twice
those calculated for ortho-ammonia based on the simplifying assumptions, indicating that
Eq. (1) and an OPR of 1 can be used as a
good approximation of a far more complicated situation.
where N
is the total column density of NH3 in cm-2 and ΔV
is the full-width at half-maximum of the line profile in km s-1. The assumption
of an excitation temperature close to the temperature of the CMB is thus a good one. In
the fifth column of Table 2, the total ammonia
column densities calculated from this expression are presented for the observed
line-of-sight features. These column densities are all only slightly larger than twice
those calculated for ortho-ammonia based on the simplifying assumptions, indicating that
Eq. (1) and an OPR of 1 can be used as a
good approximation of a far more complicated situation.
4.3. Water
Since the H2O absorptions in the line-of-sight clouds are highly saturated, it
is practically impossible to analyse them directly. Only one of these clouds exhibits
absorption from the less common isotopes, that is the 3 kpc arm, feature C,
in . A Gaussian optical depth fit to this
feature shows that it is optically thin
(τc < 0.1), slightly broader than
the corresponding NH3 fit
(ΔVFWHM = 6.5 km s-1) and caused
by an o- column density of
9.7 × 1011 cm-2 or more (using Eq. (1) with appropriate constants). This infers a lower limit to the
o- abundance of 6 × 10-11 using
H2CO as an H2 column density tracer (see end of Sect. 4.1).
From the absence of absorption at this velocity in the spectrum, we derived a 3σ upper
limit of N(o -) ≤ 7.8 × 1011 cm-2 in
the 3 kpc arm, assuming that all the o- molecules are in their ground state, and that
the line width is the same as for . Thus, adopting an isotope ratio of
[18O/17O] = 3.5 (Penzias
1981), we also derived an upper limit to the column density of
o- in feature C of
2.7 × 1012 cm-2. Although more extensive surveys suggest that
[18O/17O] varies from 2.9 near the centre to 5.0 at
R = 16.5 kpc, the adopted value is still appropriate for the 3 kpc arm
(Wouterloot et al. 2008).
The total water abundance in the 3 kpc arm is then
2 × 10⁻⁸ ≤ X[H2O] ≤ 4 × 10⁻⁷,
assuming an isotope ratio in water of [16O/18O] = 260 (Whiteoak & Gardner 1981) and a non-LTE OPR
of 1. This interval lies slightly below the values presented for line-of-sight clouds
towards Sgr B2 observed by SWAS
(X[o-H2O] ~ 6 × 10⁻⁷), but these results are not
inconsistent since feature C is not clearly distinguishable in the
SWAS spectrum due to noise and possible baseline
problems, and the SWAS column has been calculated over a much larger
velocity range of 40 km s-1 (Neufeld et al.
2000). Our result also agrees with the lower limit to the water abundance in the
3 kpc arm,
X[H2O] > 2 × 10⁻⁹,
obtained from the observed H2O absorption towards Sgr A by Odin (Sandqvist et al. 2003).
5. The Sgr B2 molecular cloud
The absorption features around +60 km s-1, collectively referred to as feature G, originating in the gas around Sgr B2 itself, are optically thick in both ammonia and water (main isotopes). They are also the results of superimposed absorption and emission, which is evident in the water spectrum, but also indicated by the broad, flattish bottom of the ammonia absorption above zero intensity (Fig. 1). In addition, a multitude of higher energy transitions of both species has been observed at this velocity (Hüttemeister et al. 1995; Ceccarelli et al. 2002; Comito et al. 2003; Wilson et al. 2006; Cernicharo et al. 2006), which is indicative of high excitation. The interpretation made by several of these authors has been that the source geometry of Sgr B2 must include a hot envelope or layer, with Tkin = 200–1000 K, outside the warm envelope surrounding the hot cores (M) and (N). Thus, the nature of Sgr B2 makes the analysis of feature G far more complex than that of the line-of-sight absorptions.
5.1. NH3
Decomposition of the NH3 absorption feature G into Gaussian components is not unique owing to the possibly non-Gaussian intrinsic line shapes; however, it does enable us to discern three absorbing clouds at about +56, +65, and +85 km s-1. This interpretation is in rough agreement with maps of 6 cm formaldehyde absorption in the region, where strong absorption at ~65 km s-1 is seen towards all four continuum peaks within the FWHM of the Odin beam, while the +80 km s-1 absorption only shows up towards Sgr B2 (N) (Mehringer et al. 1995). This indicates that the ammonia clouds absorbing at feature G are extended, such as those containing the water, and that the Sgr B2 (M) continuum source is located on the near side of the +80 km s-1 cloud, while Sgr B2 (N) is on the far side, implying a physical separation larger than the projected one.
Non-LTE models (see Sect. 4.2) for the highly excited ammonia gas directly associated with Sgr B2 suggest an alternative explanation of the absorption observed in highly excited metastable states up to (J,K) = (18,18). If NH3 is formed by exoergic gas-phase reactions corresponding to a formation temperature Tform > 1000 K, then the metastable levels (J,K) for J > 10 can be populated with an apparent rotational excitation temperature Trot > 600 K without the need for a hot layer of high kinetic temperature. Details of this scenario will be discussed elsewhere.
5.2. 15NH3 and [14N/15N]
As mentioned above, the 14NH3 absorption from the Sgr B2 cloud can be divided into three Gaussian optical depth components. For the 15NH3 absorption data, however, the signal-to-noise ratio is not very high, and a similar decomposition of this line is ambiguous. Nevertheless, both the 14NH3 to 15NH3 optical depth ratio variation across the absorption feature, as well as a Gaussian optical depth fitting to the 15NH3 line with fixed velocities and widths adopted from the 14NH3 components, indicate that only the two highest velocity components are present in 15NH3. Since the +56 km s-1 component is stronger than that at +85 km s-1 in the main isotopologue, this would indicate that the relative abundances of 14NH3 and 15NH3 are different in these clouds, with an unusually high [14N/15N] ratio in the +56 km s-1 component.
The [14N/15N] isotopic ratio in the solar system has been determined to be ~435 (Asplund et al. 2009), and direct measurements for nearby cold, dense clouds infer lower ratios of ~334 (Lis et al. 2010). However, the ratio is not very well known for the interstellar medium of the Galactic centre. Because of the combination of low 15N abundance and high optical depth in main molecular isotope lines, [14N/15N] has mostly been measured in the form of a double ratio, which of course introduces substantial uncertainites. For example, Wannier et al. (1981) derived the ratio in the inner galaxy to be 500 ± 100 from observations of H13CN and HC15N, while Guesten & Ungerechts (1985) found values of [14N/15N] ~ 1000 for two molecular clouds in the Sgr A complex from observations of the 14NH3 and 15NH3 metastable inversion lines (1, 1) and (2, 2). Dahmen et al. (1995) used additional H13CN and HC15N observations in the Galactic disk to measure a positive gradient in the ratio as a function of Galactocentric distance. However, the previously observed Galactic centre values were excluded from this fit, which instead inferred an interpolated [14N/15N] isotopic ratio at the Galactic centre of only 290 ± 65.
By fitting one Gaussian optical depth component to 15NH3, centred on ~+67 km s-1, we derived a lower limit to the column density of o − 15NH3 from Eq. (1) of 1.0 × 1013 cm-2. For comparison, when decomposing the absorption into two components, the lower limits would be 8.4 × 1012 cm-2 and 1.8 × 1012 cm-2 for the +65 and the +85 km s-1, respectively. The column density of all the 15NH3 gas giving rise to this absorption then depends on which excitation temperature most accurately describes the population distribution and what the OPR is. For example, if the absorption in this transition is well described by the model for the NH3 rotation-inversion lines observed by ISO (Ceccarelli et al. 2002), arising in a hot foreground layer (Tkin = 700 K, N(NH3) = 3 × 1016 cm-2), the [14N/15N] would have to be of the order of unity, almost three orders of magnitude smaller than expected. Thus, the major part of the ground-state 15NH3 absorption is not likely to have such a hot origin. Instead, if most of this absorption were to originate in the warm envelope (Tkin = 20 − 40 K, Lis & Goldsmith 1991) with the same column density of 14NH3 as found by Ceccarelli et al. (2002), the [14N/15N] isotopic ratio would lie between 600 and 1500 (for OPR=1), in agreement with previous measurements. A high [14N/15N] isotopic ratio is expected when the dominant nucleosynthesis process is CNO hydrogen burning, since the slow reaction of 14N(p,γ)15O is the one setting the pace of the cycle.
5.3. Water
The water excitation in the envelope around and the core(s) within Sgr B2 has previously
been examined and modelled by several authors. Neufeld
et al. (2003) used the SWAS measurements of the  and
and  110 − 101 lines (Neufeld et al. 2000) to show that the observed profiles
could form in the envelope itself or in a hot foreground layer. By also including HDO
observations, Comito et al. (2003) advocated the
latter scenario. Cernicharo et al. (2006) extended
the previous modelling efforts by using several ISO far-IR water lines and the
313 − 220 183 GHz line. They concluded that far-IR lines form in a
hot layer but that the 183 GHz emission clearly has to come from the colder and denser
envelope gas. Taken together, the picture is complicated and the water ground-state lines,
seen mostly in absorption, may in principle be formed in both regions.
110 − 101 lines (Neufeld et al. 2000) to show that the observed profiles
could form in the envelope itself or in a hot foreground layer. By also including HDO
observations, Comito et al. (2003) advocated the
latter scenario. Cernicharo et al. (2006) extended
the previous modelling efforts by using several ISO far-IR water lines and the
313 − 220 183 GHz line. They concluded that far-IR lines form in a
hot layer but that the 183 GHz emission clearly has to come from the colder and denser
envelope gas. Taken together, the picture is complicated and the water ground-state lines,
seen mostly in absorption, may in principle be formed in both regions.
The water excitation and radiative transfer calculations of  are complicated significantly by the very large
optical depths encountered, subthermal excitation, and possibility of population
inversion. We include these non-LTE effects by using an accelerated lambda iteration
scheme (ALI, Rybicki & Hummer 1991) to
solve the radiative transfer in a spherically symmetric model cloud. The ALI code we
employed is the same as that used and tested by Justtanont
et al. (2005) and Maercker et al. (2008).
For the Sgr B2 cloud, we adopt the size, as well as gas and dust physical parameters for
the envelope, provided by Zmuidzinas et al. (1995),
since those reproduce the observed continuum level around 557 GHz. The only parameter we
adjusted to help reproduce the observations was the H2O abundance. We used a
turbulent velocity of 8 kms-1. In addition, a thin outermost shell could have
been added to mimic the hot layer. When this was included, we adopted the parameters of
Comito et al. (2003).
are complicated significantly by the very large
optical depths encountered, subthermal excitation, and possibility of population
inversion. We include these non-LTE effects by using an accelerated lambda iteration
scheme (ALI, Rybicki & Hummer 1991) to
solve the radiative transfer in a spherically symmetric model cloud. The ALI code we
employed is the same as that used and tested by Justtanont
et al. (2005) and Maercker et al. (2008).
For the Sgr B2 cloud, we adopt the size, as well as gas and dust physical parameters for
the envelope, provided by Zmuidzinas et al. (1995),
since those reproduce the observed continuum level around 557 GHz. The only parameter we
adjusted to help reproduce the observations was the H2O abundance. We used a
turbulent velocity of 8 kms-1. In addition, a thin outermost shell could have
been added to mimic the hot layer. When this was included, we adopted the parameters of
Comito et al. (2003).
In Fig. 5, we show the model results for the
ortho-water abundances, ![$X[{\rm H_2^{16}O}] = 9.6\times 10^{-8}$](/articles/aa/full_html/2010/14/aa13766-09/aa13766-09-eq177.png) ,
,
![$X[{\rm H_2^{18}O}] = 8 \times 10^{-10}$](/articles/aa/full_html/2010/14/aa13766-09/aa13766-09-eq178.png) , and
, and
![$X[{\rm H_2^{17}O}] = 3.2 \times 10^{-10}$](/articles/aa/full_html/2010/14/aa13766-09/aa13766-09-eq179.png) . The
abundances of the rarer species were determined by matching the absorption around
+62 km s-1. The abundance of the main species was set according to the
ratio
. The
abundances of the rarer species were determined by matching the absorption around
+62 km s-1. The abundance of the main species was set according to the
ratio ![$X[{\rm H_2^{16}O}]/X[{\rm H_2^{18}O}] = 120$](/articles/aa/full_html/2010/14/aa13766-09/aa13766-09-eq180.png) , which in turn had been based upon the
16O/18O ratio from SO and SO2 observations in the
central core of Sgr B2(M) by Nummelin et al.
(2000). Because of the high optical depth of the H
, which in turn had been based upon the
16O/18O ratio from SO and SO2 observations in the
central core of Sgr B2(M) by Nummelin et al.
(2000). Because of the high optical depth of the H O line, the abundance
of the main water isotopologue is not constrained by the model. A ratio
O line, the abundance
of the main water isotopologue is not constrained by the model. A ratio
![$X[{\rm H_2^{16}O}]/X[{\rm H_2^{18}O}] \leq 300$](/articles/aa/full_html/2010/14/aa13766-09/aa13766-09-eq182.png) cannot in principle be excluded. However, we
note that the central part of the main water absorption profile is very sensitive to the
number of shells that the model cloud is divided into. If too few, the absorption profile
becomes too shallow. For a reasonable para-water abundance, 9.6 × 10⁻⁸, this
model also closely reproduces the 183 GHz observations. Hence, we obtained the same result
as Cernicharo et al. (2006) that a total water
abundance of 2 × 10⁻⁷ is adequate to explain the 183 GHz observations. The
515 − 422 325 GHz line observed by Melnick et al. (1993) was also fitted within the uncertainties. In addition, the
same water abundance was able to fully explain the ground-state water profiles (Fig. 5). Moreover, the ratio
cannot in principle be excluded. However, we
note that the central part of the main water absorption profile is very sensitive to the
number of shells that the model cloud is divided into. If too few, the absorption profile
becomes too shallow. For a reasonable para-water abundance, 9.6 × 10⁻⁸, this
model also closely reproduces the 183 GHz observations. Hence, we obtained the same result
as Cernicharo et al. (2006) that a total water
abundance of 2 × 10⁻⁷ is adequate to explain the 183 GHz observations. The
515 − 422 325 GHz line observed by Melnick et al. (1993) was also fitted within the uncertainties. In addition, the
same water abundance was able to fully explain the ground-state water profiles (Fig. 5). Moreover, the ratio ![$X[{\rm H_2^{18}O}]/X[{\rm H_2^{17}O}] = 2.5$](/articles/aa/full_html/2010/14/aa13766-09/aa13766-09-eq186.png) was well-constrained by the observations, and
several of the low-energy far-IR ISO lines were acceptably fitted by this model.
was well-constrained by the observations, and
several of the low-energy far-IR ISO lines were acceptably fitted by this model.
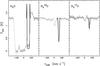 |
Fig. 5 The ALI model results, not including the hot layer, in black, superimposed on the Odin observations (grey) for the three ground-state water lines. |
We introduced the proposed hot layer to our model by including a hot shell
(Tk = 500 K,
n(H2) = 103 cm-3, and thickness
6 × 1016 cm) with high water abundance outside the cloud and lowering the
abundance in the envelope where the kinetic temperature falls below 100 K. For the rarer
species, we derived good fits when adopting the ortho abundances ![$X[{\rm H_2^{18}O}] = 2\times 10^{-6}$](/articles/aa/full_html/2010/14/aa13766-09/aa13766-09-eq190.png) and
and
![$X[{\rm H_2^{17}O}] = 8\times 10^{-7}$](/articles/aa/full_html/2010/14/aa13766-09/aa13766-09-eq191.png) in the warm
shell. However, for a main water abundance of (3−6) × 10-4 the resulting
absorption was not strong at all and mixed with emission. As above, we found that
in the warm
shell. However, for a main water abundance of (3−6) × 10-4 the resulting
absorption was not strong at all and mixed with emission. As above, we found that
![$X[{\rm H_2^{18}O}]/X[{\rm H_2^{17}O}] = 2.5$](/articles/aa/full_html/2010/14/aa13766-09/aa13766-09-eq193.png) .
.
Both our ALI modelling and a direct comparison of the optical depths of the absorptions
imply an to ratio of 2.5–3 in feature G. This
is lower than the mean value for the [18O/17O] isotopic ratio in the
Galactic disc, 3.5, as estimated by Penzias (1981),
but consistent with determinations of this ratio from the three lowest rotational states
of C18O and C17O in Sgr B2 (2.9, Wouterloot et al. 2008). This trend of a low [18O/17O]
isotopic ratio strengthens the argument from the high observed
[14N/15N] (see Sect. 5.2)
that the dominant nucleosynthesis process in the Galactic centre is CNO hydrogen burning.
The reason is that the reaction 18O(p,α)15N in the
third part of the cycle depletes the C18O relative to C17O (e.g.
Rolfs & Rodney 1974). Furthermore, the
Galactic disc is expected to have a higher [18O/17O] isotopic ratio
since models by Rauscher et al. (2002) for massive
population I stars, typical of the Galactic disk, result in 17O production
factors lower than both that of 16O and 18O.
6. Conclusions
We have presented ground-state NH3 absorption from seven distinct velocity features along the line-of-sight towards Sgr B2. We have identified an almost linear correlation between the column densities of NH3 and CS, as well as a square-root relation to N2H+. Modelling the non-LTE excitation effects of ammonia in diffuse gas, we have found that the low excitation limit, Tex = TCMB, provides a good approximation of the column densities. The ammonia abundance in the Galactic disk clouds is shown to be about 0.5–1 × 10⁻⁸. Considering the observed similarities between diffuse clouds in the inner spiral arms towards Sgr B2 and clouds outside the solar circle, in terms of both ammonia abundance and the relation between NH3 and CS, a similar nature cannot be ruled out.
From the detection of absorption in for the 3 kpc arm, in combination with its absence
in the spectrum, we conclude that the water abundance
of this arm is 2 × 10⁻⁸–4 × 10⁻⁷, compared to ~10-8 for
ammonia.
The Sgr B2 molecular cloud itself is seen in absorption in NH3, H2O,
, and , with emission superimposed on the absorption in
the main isotopologues. The non-LTE excitation of NH3 in the environment of
Sgr B2 could be explained without invoking an unusually hot (200–1000 K) molecular layer in
addition to the warm envelope gas. In addition, our non-LTE ALI modelling of Sgr B2
demonstrated that a hot layer is also not required to explain the observed line profiles of
the 11,0 ← 10,1 transition from
H2O and its isotopologues.
We also presented ground state 15NH3 absorption from the Sgr B2
molecular cloud. Both the high [14N/15N] isotopic ratio inferred from
this detection (> 600), as well as the low
to ratio (2.5–3) in the Sgr B2 cloud, indicate that
the dominant nucleosynthesis process in the Galactic centre is CNO hydrogen burning.
Odin is a Swedish-led satellite project funded jointly by the Swedish National Space Board (SNSB), the Canadian Space Agency (CSA), the National Technology Agency of Finland (Tekes), and the centre National d'Études Spatiales (CNES, France). The Swedish Space Corporation (SSC) was the industrial prime contractor and is also responsible for the satellite operation.
Acknowledgments
Generous financial support from the Research Councils and Space Agencies in Canada, Finland, France, and Sweden is gratefully acknowledged.
References
- Asplund, M., Grevesse, N., Sauval, A. J., & Scott, P. 2009, ARA&A, 47, 481 [NASA ADS] [CrossRef] [Google Scholar]
- Bissantz, N., Englmaier, P., & Gerhard, O. 2003, MNRAS, 340, 949 [NASA ADS] [CrossRef] [Google Scholar]
- Bobylev, V. V., Bajkova, A. T., & Lebedeva, S. V. 2007, Astron. Lett., 33, 720 [NASA ADS] [CrossRef] [MathSciNet] [Google Scholar]
- Ceccarelli, C., Baluteau, J.-P., Walmsley, M., et al. 2002, A&A, 383, 603 [NASA ADS] [CrossRef] [EDP Sciences] [Google Scholar]
- Cernicharo, J., Goicoechea, J. R., Pardo, J. R., & Asensio-Ramos, A. 2006, ApJ, 642, 940 [NASA ADS] [CrossRef] [Google Scholar]
- Cheung, A. C., Rank, D. M., Townes, C. H., Knowles, S. H., & ,Sullivan III, W. T. 1969, ApJ, 157, L13 [NASA ADS] [CrossRef] [Google Scholar]
- Comito, C., Schilke, P., Gerin, M., et al. 2003, A&A, 402, 635 [NASA ADS] [CrossRef] [EDP Sciences] [Google Scholar]
- Dahmen, G., Wilson, T. L., & Matteucci, F. 1995, A&A, 295, 194 [NASA ADS] [Google Scholar]
- Danby, G., Flower, D. R., Valiron, P., Schilke, P., & Walmsley, C. M. 1988, MNRAS, 235, 229 [NASA ADS] [CrossRef] [Google Scholar]
- Dickel, H. R., & Goss, W. M. 1990, ApJ, 351, 189 [NASA ADS] [CrossRef] [Google Scholar]
- Dickel, H., Goss, W. M., & Condon, G. R. 1997, Astronomy Data Image Library, 1 [Google Scholar]
- Downes, D., Wilson, T. L., Bieging, J., & Wink, J. 1980, A&AS, 40, 379 [NASA ADS] [Google Scholar]
- Eisenhauer, F., Genzel, R., Alexander, T., et al. 2005, ApJ, 628, 246 [NASA ADS] [CrossRef] [Google Scholar]
- Englmaier, P., & Gerhard, O. 1999, MNRAS, 304, 512 [NASA ADS] [CrossRef] [Google Scholar]
- Frisk, U., Hagström, M., Ala-Laurinaho, J., et al. 2003, A&A, 402, L27 [NASA ADS] [CrossRef] [EDP Sciences] [Google Scholar]
- Gardner, F. F., Boes, F., & Winnewisser, G. 1988, A&A, 196, 207 [NASA ADS] [Google Scholar]
- Garwood, R. W., & Dickey, J. M. 1989, ApJ, 338, 841 [NASA ADS] [CrossRef] [Google Scholar]
- Goldsmith, P. F., Lis, D. C., Hills, R., & Lasenby, J. 1990, ApJ, 350, 186 [NASA ADS] [CrossRef] [Google Scholar]
- Greaves, J. S., & Nyman, L.-A. 1996, A&A, 305, 950 [NASA ADS] [Google Scholar]
- Greaves, J. S., & Williams, P. G. 1994, A&A, 290, 259 [NASA ADS] [Google Scholar]
- Guesten, R., & Ungerechts, H. 1985, A&A, 145, 241 [NASA ADS] [Google Scholar]
- Ho, P. T. P., & Townes, C. H. 1983, ARA&A, 21, 239 [NASA ADS] [CrossRef] [Google Scholar]
- Hüttemeister, S., Wilson, T. L., Henkel, C., & Mauersberger, R. 1993, A&A, 276, 445 [NASA ADS] [Google Scholar]
- Hüttemeister, S., Wilson, T. L., Mauersberger, R., et al. 1995, A&A, 294, 667 [NASA ADS] [Google Scholar]
- Justtanont, K., Bergman, P., Larsson, B., et al. 2005, A&A, 439, 627 [NASA ADS] [CrossRef] [EDP Sciences] [Google Scholar]
- Lis, D. C., & Goldsmith, P. F. 1991, ApJ, 369, 157 [NASA ADS] [CrossRef] [Google Scholar]
- Lis, D. C., Wootten, A., Gerin, M., & Roueff, E. 2010, ApJ, 710, L49 [NASA ADS] [CrossRef] [Google Scholar]
- Liszt, H., & Lucas, R. 2002, A&A, 391, 693 [NASA ADS] [CrossRef] [EDP Sciences] [Google Scholar]
- Liszt, H. S., Lucas, R., & Pety, J. 2006, A&A, 448, 253 [NASA ADS] [CrossRef] [EDP Sciences] [Google Scholar]
- Maercker, M., Schöier, F. L., Olofsson, H., Bergman, P., & Ramstedt, S. 2008, A&A, 479, 779 [NASA ADS] [CrossRef] [EDP Sciences] [Google Scholar]
- Mehringer, D. M., Palmer, P., & Goss, W. M. 1995, ApJS, 97, 497 [NASA ADS] [CrossRef] [Google Scholar]
- Melnick, G. J., Menten, K. M., Phillips, T. G., & Hunter, T. 1993, ApJ, 416, L37 [NASA ADS] [CrossRef] [Google Scholar]
- Menon, T. K., & Ciotti, J. E. 1970, Nature, 227, 579 [NASA ADS] [CrossRef] [PubMed] [Google Scholar]
- Neufeld, D. A., Ashby, M. L. N., Bergin, E. A., et al. 2000, ApJ, 539, L111 [NASA ADS] [CrossRef] [Google Scholar]
- Neufeld, D. A., Bergin, E. A., Melnick, G. J., & Goldsmith, P. F. 2003, ApJ, 590, 882 [NASA ADS] [CrossRef] [Google Scholar]
- Nishiyama, S., Nagata, T., Sato, S., et al. 2006, ApJ, 647, 1093 [NASA ADS] [CrossRef] [Google Scholar]
- Nummelin, A., Bergman, P., Hjalmarson, Å, et al. 2000, ApJS, 128, 213 [NASA ADS] [CrossRef] [Google Scholar]
- Olberg, M., Frisk, U., Lecacheux, A., et al. 2003, A&A, 402, L35 [NASA ADS] [CrossRef] [EDP Sciences] [Google Scholar]
- Penzias, A. A. 1981, ApJ, 249, 518 [NASA ADS] [CrossRef] [Google Scholar]
- Polehampton, E. T., Baluteau, J.-P., & Swinyard, B. M. 2005a, A&A, 437, 957 [NASA ADS] [CrossRef] [EDP Sciences] [Google Scholar]
- Polehampton, E. T., Menten, K. M., Brünken, S., Winnewisser, G., & Baluteau, J.-P. 2005b, A&A, 431, 203 [NASA ADS] [CrossRef] [EDP Sciences] [Google Scholar]
- Polehampton, E. T., Baluteau, J.-P., Swinyard, B. M., et al. 2007, MNRAS, 377, 1122 [NASA ADS] [CrossRef] [Google Scholar]
- Rauscher, T., Heger, A., Hoffman, R. D., & Woosley, S. E. 2002, ApJ, 576, 323 [NASA ADS] [CrossRef] [Google Scholar]
- Reid, M. J., Menten, K. M., Zheng, X. W., Brunthaler, A., & Xu, Y. 2009, ApJ, 705, 1548 [NASA ADS] [CrossRef] [Google Scholar]
- Robinson, B. J., & McGee, R. X. 1970, Aust. J. Phys. 23, 405 [NASA ADS] [Google Scholar]
- Rolfs, C., & Rodney, W. S. 1974, ApJ, 194, L63 [NASA ADS] [CrossRef] [Google Scholar]
- Rougoor, G. W., & Oort, J. H. 1960, PNAS, 46, 1 [Google Scholar]
- Rybicki, G. B., & Hummer, D. G. 1991, A&A, 245, 171 [NASA ADS] [Google Scholar]
- Sandqvist, Aa. 1970, AJ, 75, 135 [NASA ADS] [CrossRef] [Google Scholar]
- Sandqvist, Aa., Bergman, P., Black, J. H., et al. 2003, A&A, 402, L63 [NASA ADS] [CrossRef] [EDP Sciences] [Google Scholar]
- van der Tak, F. F. S., Black, J. H., Schöier, F. L., Jansen, D. J., & van Dishoeck, E. F. 2007, A&A, 468, 627 [NASA ADS] [CrossRef] [EDP Sciences] [Google Scholar]
- Vastel, C., Polehampton, E. T., Baluteau, J.-P., et al. 2002, ApJ, 581, 315 [NASA ADS] [CrossRef] [Google Scholar]
- Wadiak, E. J., Rood, R. T., & Wilson, T. L. 1988, ApJ, 324, 931 [NASA ADS] [CrossRef] [Google Scholar]
- Walmsley, C. M., & Ungerechts, H. 1983, A&A, 122, 164 [NASA ADS] [Google Scholar]
- Wannier, P. G., Linke, R. A., & Penzias, A. A. 1981, ApJ, 247, 522 [NASA ADS] [CrossRef] [Google Scholar]
- Whiteoak, J. B., & Gardner, F. F. 1979, MNRAS, 188, 445 [NASA ADS] [Google Scholar]
- Whiteoak, J. B., & Gardner, F. F. 1981, MNRAS, 197, 39P [Google Scholar]
- Whiteoak, J. B., Gardner, F. F., Manefield, G. A., Höglund, B., & Johansson, L. E. B. 1985, Proc. Astron. Soc. Aust., 6, 6 [NASA ADS] [Google Scholar]
- Wilson, T. L., Henkel, C., & Hüttemeister, S. 2006, A&A, 460, 533 [NASA ADS] [CrossRef] [EDP Sciences] [Google Scholar]
- Wouterloot, J. G. A., Henkel, C., Brand, J., & Davis, G. R. 2008, A&A, 487, 237 [NASA ADS] [CrossRef] [EDP Sciences] [Google Scholar]
- Yurchenko, S., Barber, R., Yachmenev, A., et al. 2009, J. Phys. Chem. A, 113, 11845 [CrossRef] [PubMed] [Google Scholar]
- Zmuidzinas, J., Blake, G. A., Carlstrom, J., Keene, J., & Miller, D. 1995, ApJ, 447, L125 [NASA ADS] [CrossRef] [PubMed] [Google Scholar]
- Zuckerman, B., Buhl, D., Palmer, P., & Snyder, L. E. 1970, ApJ, 160, 485 [NASA ADS] [CrossRef] [Google Scholar]
All Tables
Results of optical depth fits and resulting o-NH3 abundances derived from H2CO observations by Wadiak et al. (1988) and CH observations by Polehampton et al. (2005b).
All Figures
|
Fig. 1 Part of the Odin spectra towards Sgr B2. The absorption features marked A–G are identified in Table 1. The radial velocity is indicated with respect to the local standard of rest and to the rest frequencies listed in Sect. 2. |
| In the text | |
|
Fig. 2 The full observed band covering the NH3 absorptions towards Sgr B2. In addition to 14NH3, the ground state 15NH3 line, seen in absorption, and the 151,15–140,14 CH3OH transition, seen in emission, are marked at VLSR = +65 km s-1, respectively. |
| In the text | |
|
Fig. 3 Column density relation between our observed o-NH3 and N2H+ and CS respectively. The column densities are calculated from optical depths integrated over five velocity bins associated with absorption features as indicated by capital letters in the plot. N2H+ and CS data as well as ranges of velocity bins are adopted from Greaves & Nyman (1996). The solid lines show the logarithmic least-square fits to each of the data sets, and their slopes are 1.15 ± 0.27 and 0.63 ± 0.07 for CS and N2H+, respectively. |
| In the text | |
|
Fig. 4 Gaussian optical depth fits to the observed ground-state NH3 absorptions, corresponding to components in formaldehyde. The spectrum in black is the continuum-subtracted (TC = 1.29 K) observed spectrum. The velocity ranges over which the fits are made are highlighted in green and the fits themselves are shown in red. The blue dashed boxes mark the velocity ranges over which the absorption is integrated for the column density comparisons in Fig. 3. |
| In the text | |
|
Fig. 5 The ALI model results, not including the hot layer, in black, superimposed on the Odin observations (grey) for the three ground-state water lines. |
| In the text | |
Current usage metrics show cumulative count of Article Views (full-text article views including HTML views, PDF and ePub downloads, according to the available data) and Abstracts Views on Vision4Press platform.
Data correspond to usage on the plateform after 2015. The current usage metrics is available 48-96 hours after online publication and is updated daily on week days.
Initial download of the metrics may take a while.