Fig. 4
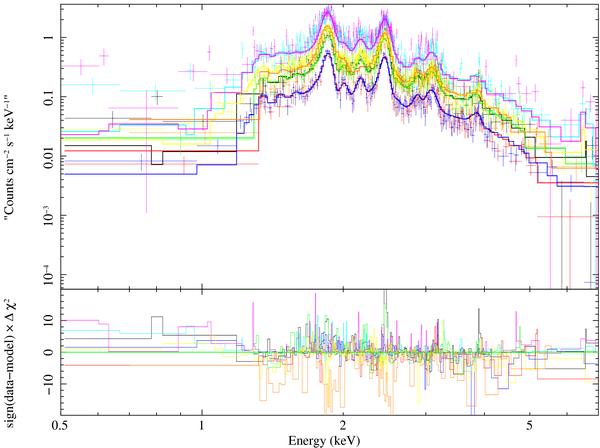
Upper panel: EPIC pn (in magenta, cyan and yellow colors) and MOS1/2 (in black, red, green and blue colors) spectra of the SNR G344.7-0.1, for the distinct observations. ACIS-I X-ray spectra of the SNR is indicated in orange. Solid lines indicate the best-fit (pshock) model (see Table 2). Lower panel: Chi-squared residual of the best-fit model.
Current usage metrics show cumulative count of Article Views (full-text article views including HTML views, PDF and ePub downloads, according to the available data) and Abstracts Views on Vision4Press platform.
Data correspond to usage on the plateform after 2015. The current usage metrics is available 48-96 hours after online publication and is updated daily on week days.
Initial download of the metrics may take a while.