Fig. 5
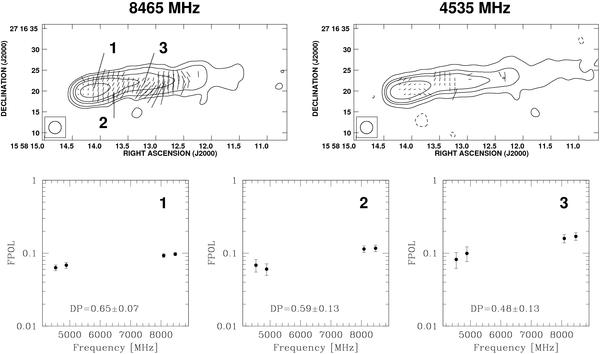
Source A2142A. Top, left: total intensity contours and polarization vectors at 3.6 cm (8465 MHz). Contour levels are drawn at: − 0.06 0.06 0.15 0.5 and 3 mJy/beam. Top, right: total intensity contours and polarization vectors at 6 cm (4535 MHz). Contour levels are drawn at: − 0.1 0.1 0.5 1 and 3 mJy/beam. The angular resolution is 3.0′′ × 3.0′′. The lines give the orientation of the electric vector position angle (E-field) and are proportional in length to the fractional polarization (1′′ ≃ 10%). Bottom: trend of the fractional polarization as a function of the observing frequencies, at different source locations. The depolarization DP has been calculated as the ratio of the fractional polarization between the two extreme frequencies.
Current usage metrics show cumulative count of Article Views (full-text article views including HTML views, PDF and ePub downloads, according to the available data) and Abstracts Views on Vision4Press platform.
Data correspond to usage on the plateform after 2015. The current usage metrics is available 48-96 hours after online publication and is updated daily on week days.
Initial download of the metrics may take a while.