Fig. A.1
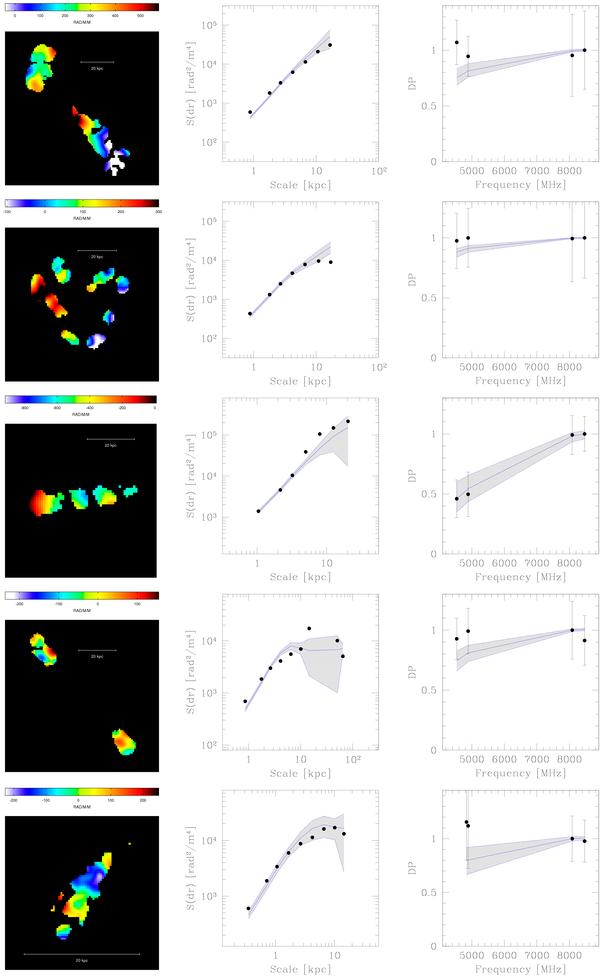
Left: examples of simulated RM images for the sources A401A, A401B, A2142, A2065, OPHIB. The simulated images have the same colour scale and resolution of the observed RM images. They have been obtained by simulating a RM power spectrum with a spectral index n = 11 / 3 and a minimum scale of the RM fluctuations Λmin = 5 kpc. The maximum scale of the RM fluctuations is Λmax = 205 kpc for A401A and A2142, Λmax = 128 kpc for A401B, Λmax = 15 kpc for OPHIB and A2065. Middle: structure functions of the simulated (grey) and observed (black points) RM images. Right: depolarization plots of the simulations (grey) and observations (black points). The depolarization is defined as DP(ν) = FPOLν / FPOL8465 MHz.
Current usage metrics show cumulative count of Article Views (full-text article views including HTML views, PDF and ePub downloads, according to the available data) and Abstracts Views on Vision4Press platform.
Data correspond to usage on the plateform after 2015. The current usage metrics is available 48-96 hours after online publication and is updated daily on week days.
Initial download of the metrics may take a while.