Fig. 3
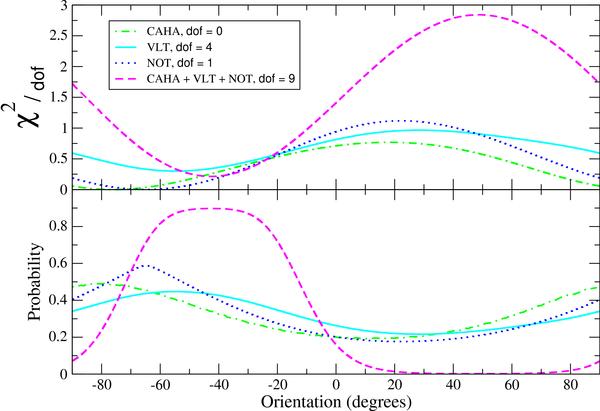
Upper panel: the evolution of the linear fit χ2/d.o.f. as a function of the fitted line orientation when constant polarization is assumed for SN 2007uy. The minima correspond to the optimal orientation of the straight lines displayed in Fig. 1 bottom panel, also given in Table 3. As seen the global shape of the evolution for the three independent data-sets (VLT, NOT and CAHA) are quite equivalent, their minima being systematically located at similar negative angles. The long-dashed line shows the χ2/d.o.f. evolution when all the data are jointly considered. We note that in the case of CAHA, given that d.o.f. = 0, χ2/d.o.f. actually represents χ2. Bottom panel: the evolution of the normalized probability associated with the above panel. As displayed the three independent data-sets show their probability maxima at a comparable orientation angle. The maximum is reinforced when all the data are combined (long-dashed line). Given that d.o.f. = 0 for CAHA, the corresponding probability distribution was obtained through a Monte Carlo method. We refer the reader to the main text for further information.
Current usage metrics show cumulative count of Article Views (full-text article views including HTML views, PDF and ePub downloads, according to the available data) and Abstracts Views on Vision4Press platform.
Data correspond to usage on the plateform after 2015. The current usage metrics is available 48-96 hours after online publication and is updated daily on week days.
Initial download of the metrics may take a while.