Fig. 5
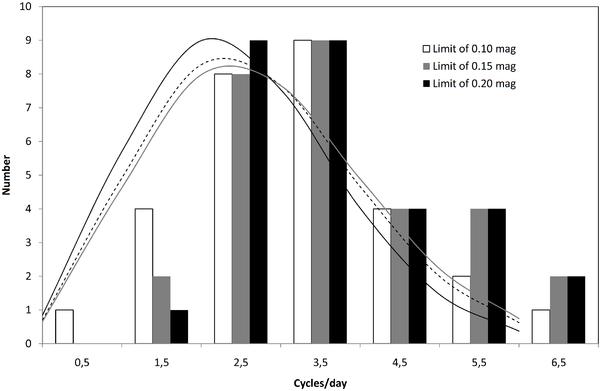
Histograms of all our sample of data. We assume that all the lightcurves with amplitudes below an arbitrary limit are single peaked and those with amplitudes larger than this limit are double peaked. White data correspond to a limit of 0.10 mag, grey data correspond to a limit of 0.15 mag and black data correspond to a limit of 0.20 mag. Dash line is the Maxwellian fit to the distribution with 0.10 mag limit. Grey line is the Maxwellian fit to the distribution with 0.15 mag limit. Black line is the Maxwellian fit to the distribution with 0.20 mag limit.
Current usage metrics show cumulative count of Article Views (full-text article views including HTML views, PDF and ePub downloads, according to the available data) and Abstracts Views on Vision4Press platform.
Data correspond to usage on the plateform after 2015. The current usage metrics is available 48-96 hours after online publication and is updated daily on week days.
Initial download of the metrics may take a while.